How I reduced an API call from >5 seconds to under 100ms
Given that 100% of the databases I have interacted with in my professional career have been SQL databases, my data-based mental model (please enjoy my pun) has always defaulted to a relational one. However, when spinning up a tiny side project in 2020 (a bot to provide interactivity to my Twitch stream), my data-storing requirements didn’t call for a relational model at the time, so I chose a NoSQL solution: MongoDB.
Four years later in 2024, this tiny side project became much larger than I ever expected, and evolved into a text-based game: Pantherworld. If you’re curious about how this evolved and would like to learn more about how this project grew from a tiny Twitch bot to a game, watch the latest edition of my 2024 conference talk, Entertainment as Code, on Youtube.
Pantherworld has been played by hundreds of people, 24 hours a day, 7 days a week via my Twitch chat interface since April 2024. Game events in Pantherworld are powered by events that happen on my stream. When something happens, such as when I get a new follower, a random world item spawns in a random world zone. The objective is for my stream audience to use text commands in the Twitch chat to move around the world and claim items to fill up their inventory. Some items are rarer than others, so will spawn less frequently.
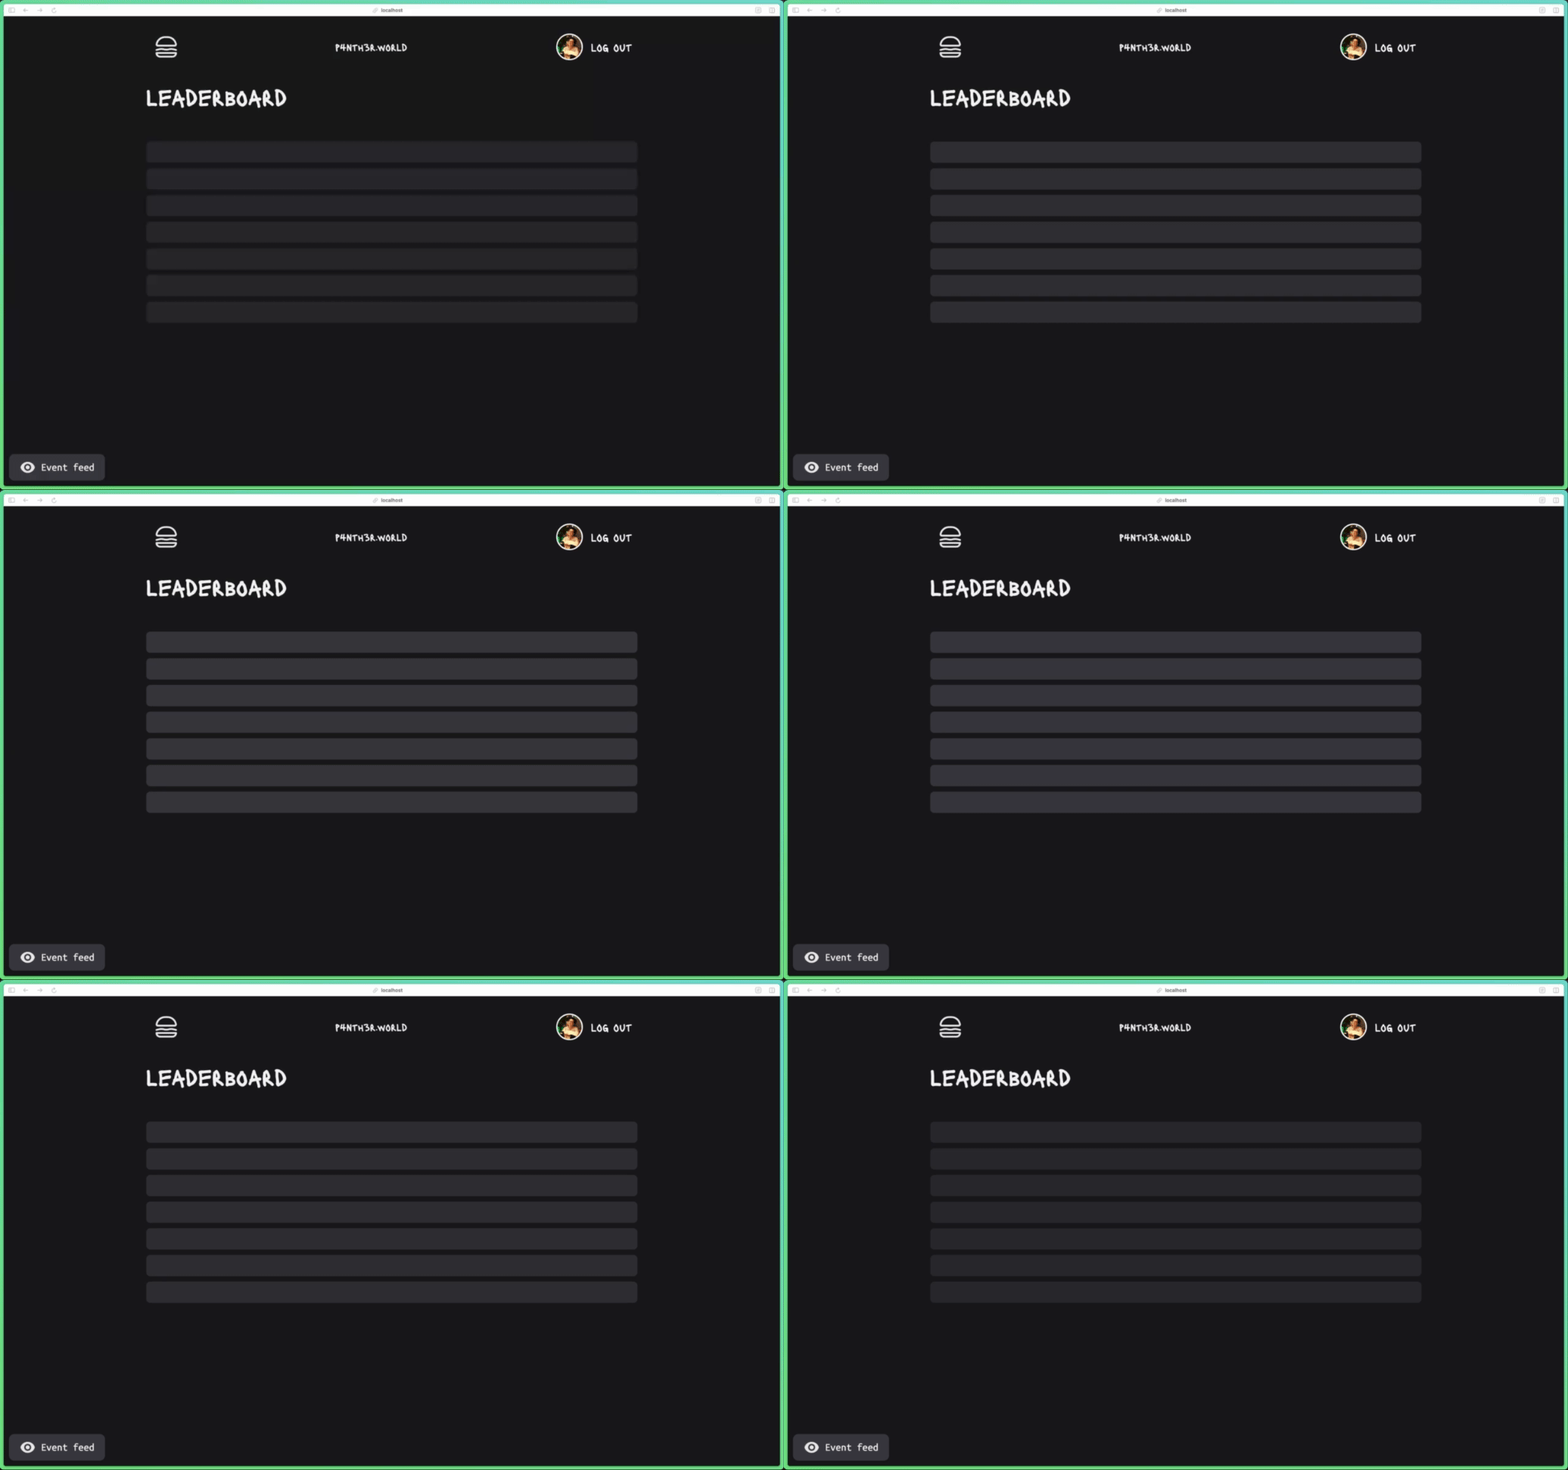
To enable players to keep track of gameplay activity, I built a front end companion app, which fetches game data from the NoSQL database via a collection of APIs. As the game attracted more and more players, there was one API call that very obviously didn’t scale: the endpoint that fetched the leaderboard data. It was painfully slow, but I had no idea why it was slow. I added a skeleton loader on the front end (instead of showing just a blank screen) to try and hide how slow it was, but it was painful to watch.

It’s important to reiterate that my data-based mental model has always defaulted to a relational one, and so I figured I was just doing NoSQL wrong but I didn’t know how I was doing it wrong. Additionally, this app had evolved so much over four years of development that the data model requirements changed to actually require a relational model, and so my initial gut reaction was to refactor the whole thing to use an SQL database. But I couldn’t face refactoring a four-year old legacy app and migrating hundreds of thousands of NoSQL documents to SQL. It was time to turn to tracing to help me understand how I could optimize this terrible code.
What is tracing?
Tracing is a technology that captures each function call, database query, network request, browser event — everything that happens in your app — allowing you to understand how your apps actually work and expose where you may be able to make performance improvements or squash bugs. In Sentry, singular events are named spans, and they are connected in the Trace View via an HTTP header sent with each span. You can also capture all of these events across your entire stack of apps and services, which is known as Distributed Tracing.
How to add tracing support for MongoDB database queries
Tracing for MongoDB database queries is supported out of the box for the latest version of the Sentry JavaScript and Python SDKs; no further setup required. My backend API is an Express app, so I’m using the latest version of the Sentry Node SDK. It’s recommended to keep all Sentry SDK initialization code in a separate file; mine is named instrument.ts. Here’s a stripped down SDK configuration in showing the most relevant options:

// instrument.ts

import * as Sentry from "@sentry/node";

Sentry.init({
  // unique Sentry project DSN (Data Source Name)
  dsn: process.env.SENTRY_DSN,
  // add environment to context in Sentry
  environment: process.env.NODE_ENV,
  // send 75% of traces to Sentry
  tracesSampleRate: 0.75,
});
The tracesSampleRate option tells the Sentry SDK to enable tracing. It takes a value between 0 and 1, and configures the percentage of traces your app will send to Sentry. It’s recommended to adjust this number based on your Sentry account plan and how many users your apps have.
To enable Distributed Tracing (i.e. trace from a front end app to a back end app), make sure to add the browserTracingIntegration to your front end Sentry SDK configuration in addition to setting the tracesSampleRate. Exceptions to this rule are full-stack front end frameworks such as Next.js and Nuxt, which add the browserTracingIntegration by default.
In the back end, to ensure that Sentry can automatically instrument all modules in your application, including MongoDB, make sure to require or import the instrument.js file before requiring any other modules in your application. Here are some of the imports at top of my app entry-point file, app.ts as an example:

// app.ts

import "./env";
import * as Sentry from "@sentry/node"; // <---- first imported module
import { webServer } from "./webserver";
import Database from "./data/database";
import WebSocketServer from "./WebSocketServer";

//... all other code
Now we’ve got tracing set up to capture MongoDB queries in my Express app, let’s investigate why my code for the leaderboard was so slow.
Why a single API call was taking >5 seconds
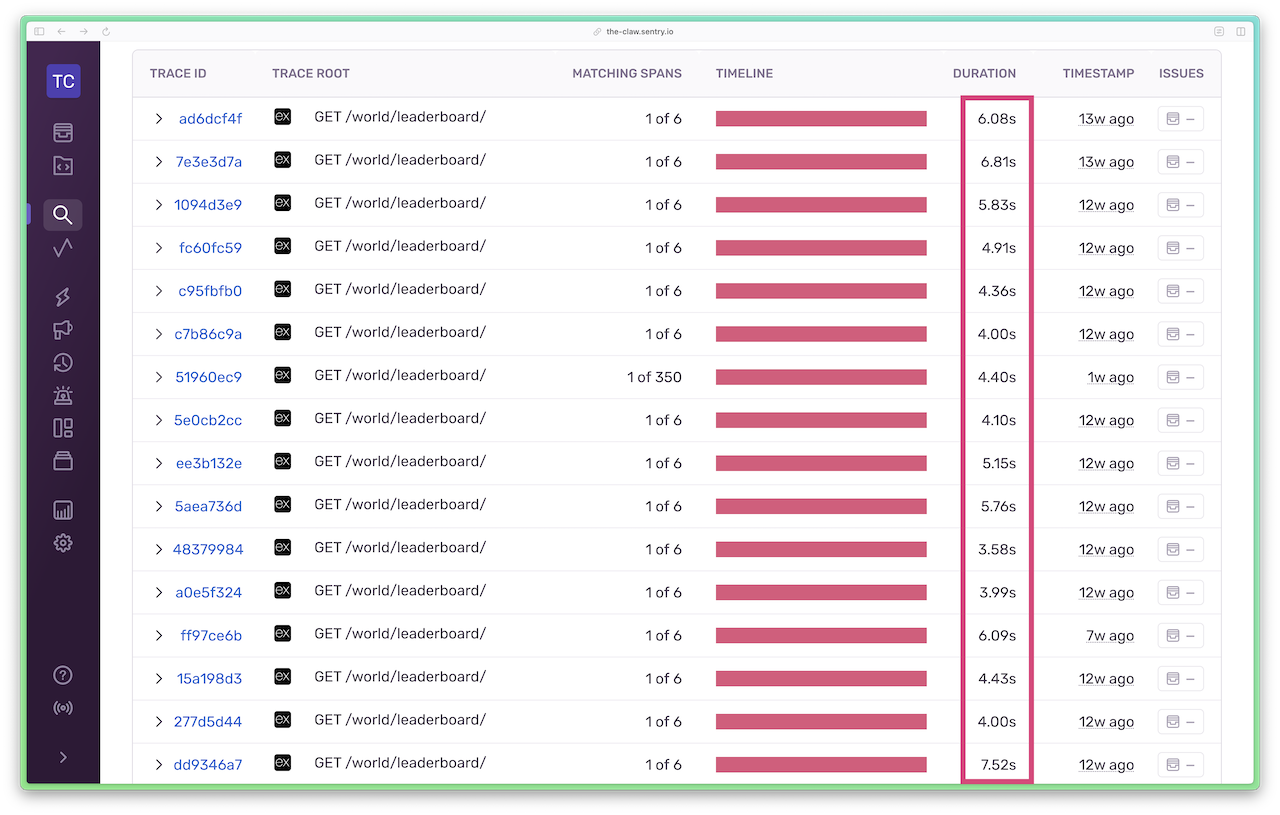
Here’s a snapshot of traces before I made the code optimizations, with the durations of the API calls highlighted. HTTP GET requests to the /world/leaderboard API were taking anywhere from 4 to almost 8 seconds.

The (zoomed out) Trace View for a single API call exposes a series of request waterfalls and duplicate database queries. Something had to be done.

Before we explore how I reduced this API call from >5 seconds to under 100ms, let’s look at what happens when a call to /world/leaderboard is made by the front end app.
The leaderboard API call returns an array of players. Each Player object contains a username, an items count, and a wealth_index number (where the wealth index is a sum of all inventory items multiplied by their rarity).

// leaderboard.ts

type Player = {
  username: string;
  items: number;
  wealth_index: number;
};

export async function getFullLeaderboard(): Promise<{players: Player[]}> {
	// ...
}
Here’s the original code, slightly simplified. It does the following:
Queries the
Itemscollection to fetch all items that are assigned to a user, groups the items byuserId, and returns a count of those itemsFor each player, calls
getAllItemsForPlayer()(which queries theItemscollection again)For each player, queries the
Playercollection (and the only purpose of this was to retrieve theuserDisplayNamewhich I didn’t want to store alongside the item data; a SQL join would have been nice here)Constructs and calculates each
Playerobject, pushes it into an array, sorts the array, and returns it.

// leaderboard.ts

// imports...

function sortByWealthIndexDesc(a: Player, b: Player) {
  // ... standard sort function
}

export async function getFullLeaderboard(): Promise<{players: Player[]}> {
  const players = await PantherworldItemModel.aggregate([
    {
      $match: {
        userId: { $ne: null },
      },
    },

    // Group documents by userId, count the number of items in each group
    { $group: { _id: "$userId", itemCount: { $sum: 1 } } },
  ]);

  const leaderboardPlayers: Player[] = [];

  const promises = players.map(async (player) => {
    const allItems: ItemForWealthIndex[] = await getAllItemsForPlayer(
      player._id,
    );

    const dbPlayer = (await PantherworldPlayerModel.findOne({
      userId: player._id,
    })) as PantherworldPlayerData;

    leaderboardPlayers.push({
      username: dbPlayer.userDisplayName,
      items: player.itemCount,
      wealth_index: getWealthIndex(allItems),
    } as Player);
  });

  await Promise.all(promises)
    .then()
    .catch((err) => {
      Sentry.captureException(err);
    });

  return {
    players: leaderboardPlayers.sort(sortByWealthIndexDesc),
  };
}
You can probably already make some guesses about the improvements that can be made. Let’s talk through the mistakes.
Mistake #1: I didn’t test with production-like data
When I wrote the leaderboard API code and tested it in development, it didn’t feel slow. It was only when I pushed the feature to production that I noticed how slow it really was. My development database contained less than 20% of the game data compared to production — and it wasn’t growing — whereas my production database was growing hour by hour, adding around 30 items and 10 players to the world per hour.
Mistake #2: “helper” functions aren’t always helpful
In trying to be a diligent and DRY (Don’t Repeat Yourself) developer, I reused an existing “helper function” — getAllItemsForPlayer() — which calculates a player’s wealth index. The problem is getAllItemsForPlayer() made a call to the Items collection to get inventory items for every... single ...player. If this code were written inline (and not abstracted out to another function), it would have been self-documenting that it wasn’t the right call to make n calls to a database (where n is the number of active players) because I’d already queried the Items table at the top of the function. I already had access to that data in the first database query.
Mistake #3: I copied and pasted code not fit-for-purpose
Before the full leaderboard API, I had written a small function to find the top three players in the game by item count, which was originally displayed on the home page. It made the following query on the Items collection:

const top3 = await PantherworldItemModel.aggregate([
  { $match: { userId: { $ne: null } } },

  // Group documents by userId, count the number of items in each group
  { $group: { _id: "$userId", itemCount: { $sum: 1 } } },

  // Sort the groups by itemCount in descending order
  { $sort: { itemCount: -1 } },

  // Select top 3
  { $limit: 3 },
]);
When you compare this code to the first query in the original getFullLeaderboard() function above, it’s the same code, just with the $sort and the $limit. Big mistake. In querying the Items collection in the full leaderboard API, I already had access to all item data, meaning I didn’t need to loop through the grouped array and use the “helper” function to getAllItemsForPlayer(). Instead, by using the $push operator in the Items collection query, I could create an array of objects mapping user IDs to an array of items owned by that user, like so:

const itemsGroupedByPlayer = await PantherworldItemModel.aggregate([
    {
      $match: {
        userId: { $ne: null },
      },
    },

    // Group documents by userId and push all items into an array
    { $group: { _id: "$userId", items: { $push: "$$ROOT" } } },
  ]);

  // Returns an array of objects shaped like this:
  // { _id: '12345', items: [...] },
How I reduced the API call from >5 seconds to under 100ms
The main culprit in this slow API call was the “helper” function that called the database n times, where n is the number of players. I removed these extra n database queries by fetching all data from the Items collection once and using $push to group the data I needed (rather than discarding it).
There was, however, some more work I had to do to build up an array of items in a particular format to be able to reuse another helper function which calculates a player’s wealth index. But it was worth it. The leaderboard function now only makes two calls to the database: one to the Items collection, and one to the Players collection. Here’s the refactored code, simplified for brevity:

// leaderboard.ts

// imports...

function constructItemsForWealthIndexCalculation(
  items,
): ItemForWealthIndex[] {
	// ...
	// this function sorts the raw items data into something usable
	// for the helper function getWealthIndex()

  return itemsForWealthIndex;
}

function sortByWealthIndexDesc(a: Player, b: Player) {
  // ... standard sort function
}

export async function getFullLeaderboard(): Promise<{players: Player[]}> {
  const itemsGroupedByPlayer = await PantherworldItemModel.aggregate([
    {
      $match: {
        userId: { $ne: null },
      },
    },

    // Group documents by userId and
    // push all items with that userId into an array
    { $group: { _id: "$userId", items: { $push: "$$ROOT" } } },
  ]);

  const leaderboardPlayers: Player[] = [];
  // get all player data in one query using the $in operator
  const allPlayerRecords = await PantherworldPlayerModel.find({
    userId: { $in: itemsGroupedByPlayer.map((player) => player._id) },
  });

  for (const player of itemsGroupedByPlayer) {
    const itemsForWealthIndex = constructItemsForWealthIndexCalculation(
      player.items,
    );

    leaderboardPlayers.push({
      username: allPlayerRecords.find(
        (playerRecord) => playerRecord.userId === player._id,
      ).userDisplayName,
      items: player.items.length,
      wealth_index: getWealthIndex(itemsForWealthIndex),
    } as Player);
  }

  return {
    players: leaderboardPlayers.sort(sortByWealthIndexDesc),
  };
}
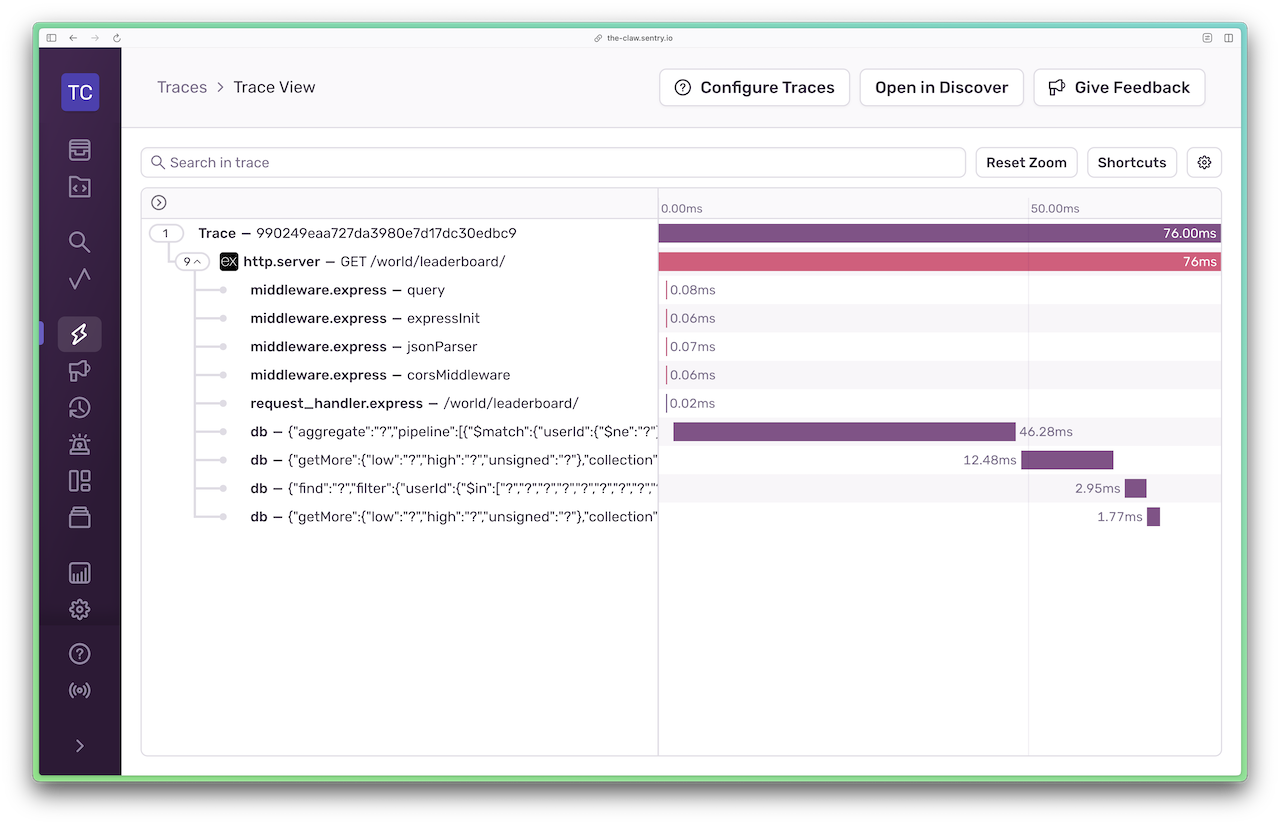
And here’s how the trace view looks after the optimizations: now under 100ms! I call that a success.

The bottom line: tracing takes out the guesswork when debugging performance issues
Without tracing, I probably could have messed around in my code for a while to find the root cause of the performance bottleneck. However, with tracing, what was causing the slowdown was obvious; Sentry showed me a clear visual representation of what was going wrong. As developers, we’ve all got jobs to do, and we’ve all (probably) got deadlines as well. Tracing is one of those things that helps us get our jobs done. And by taking out the guesswork, we can get our jobs done well and efficiently, giving us more time to go and touch grass.
Originally posted on blog.sentry.io
