How I fixed my brutal TTFB
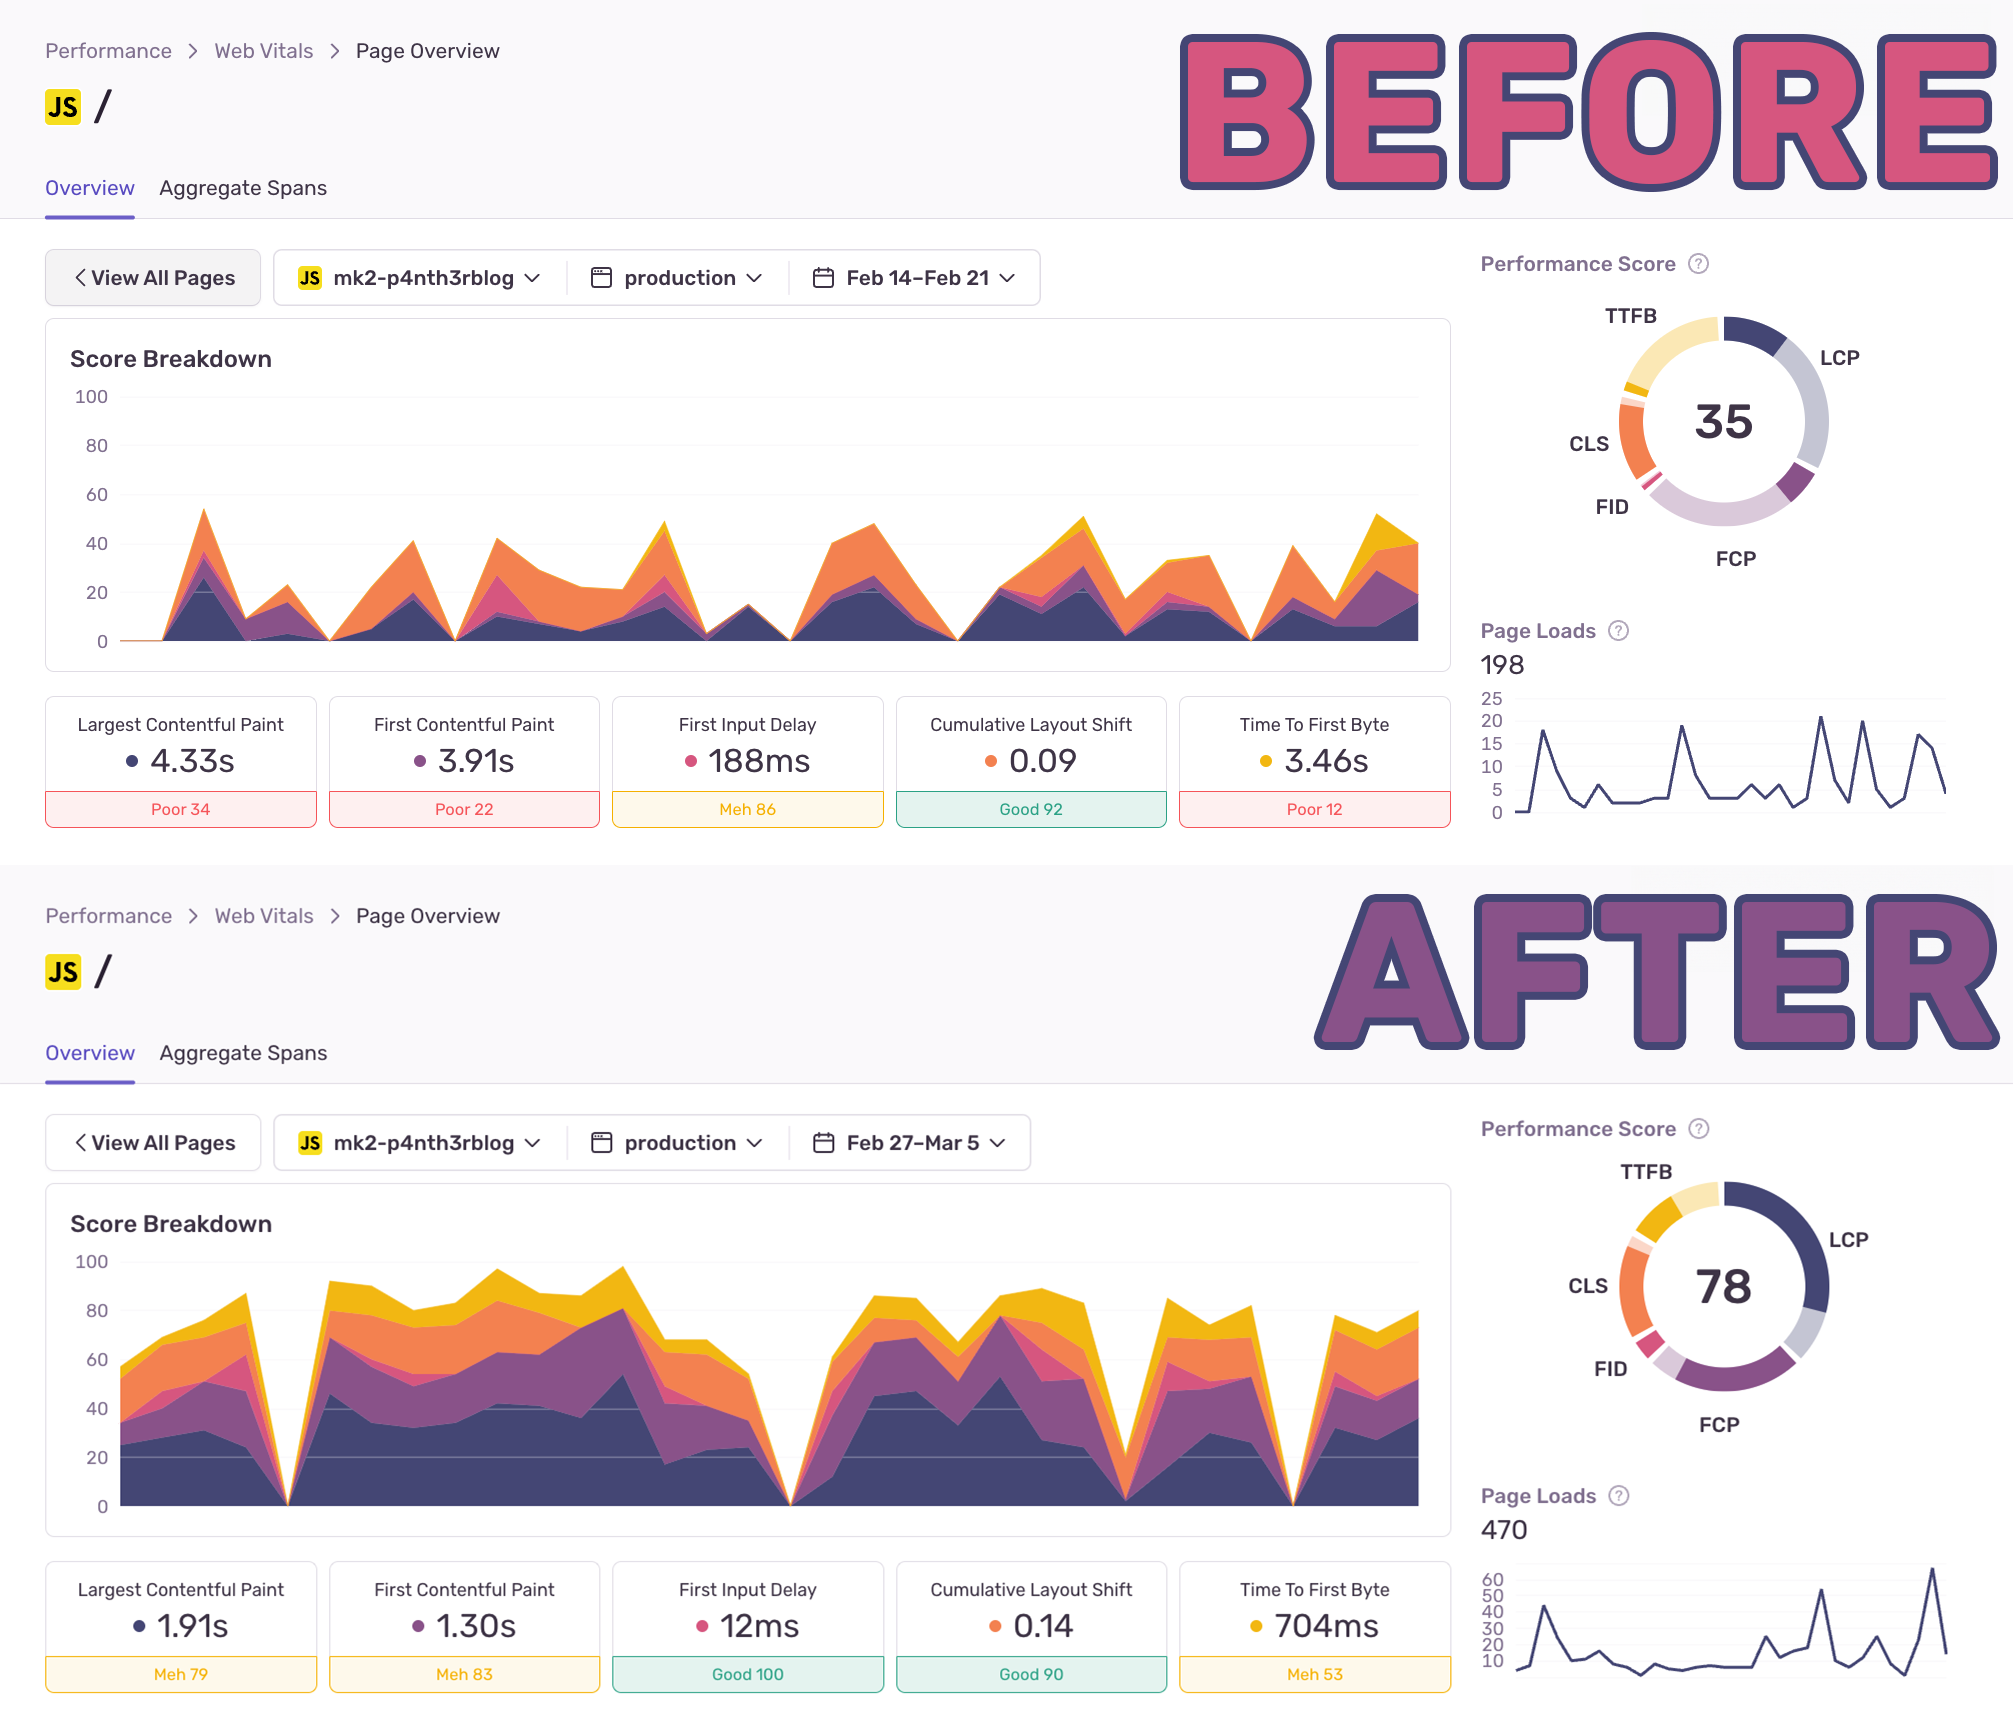
Recently, I improved all my homepage Core Web Vitals by focusing on improving just one metric: the Time to First Byte (TTFB). All it took was two small changes to how data is fetched to reduce the p75 TTFB from 3.46s to just 704ms. In this post I’ll explain how I found the issues, what I did to fix them, and the important decisions I made along the way. (And don’t worry, I’ll break down “p75” and “TTFB”, too!)
Using Sentry performance monitoring
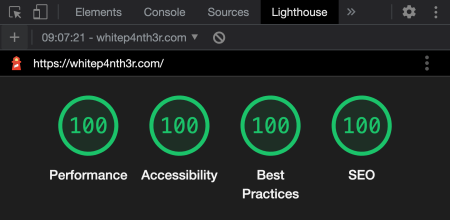
As developers, we usually focus on performance for short bursts at a time: when a new site is launching, when a new feature is in development, or when we discover our site is really, really slow. During 2021-22 I rebuilt my website from the ground up in order to improve performance and the results were great. But, over time I added so many extra bits of experimental technology to different areas of the site that performance, once again, had become embarrassingly bad. I’d noticed this myself when loading my website over the last few months, but it was only when I added Sentry performance monitoring to my site that I was able to see the full picture.
What’s great about using a performance monitoring tool like Sentry is that it shows you real user data for your websites, across all the operating systems, browsers, mobile devices, internet connections and many other factors that affect the user experience. Previously I’ve used tools such as the Google Lighthouse in development or during a website build to analyze performance for each new build — but this only gave me a snapshot of the performance scores during the build pipeline for build servers. Real user data is far more valuable.
Here’s what the performance looked like on my homepage before any modifications from February 14-21 2024.
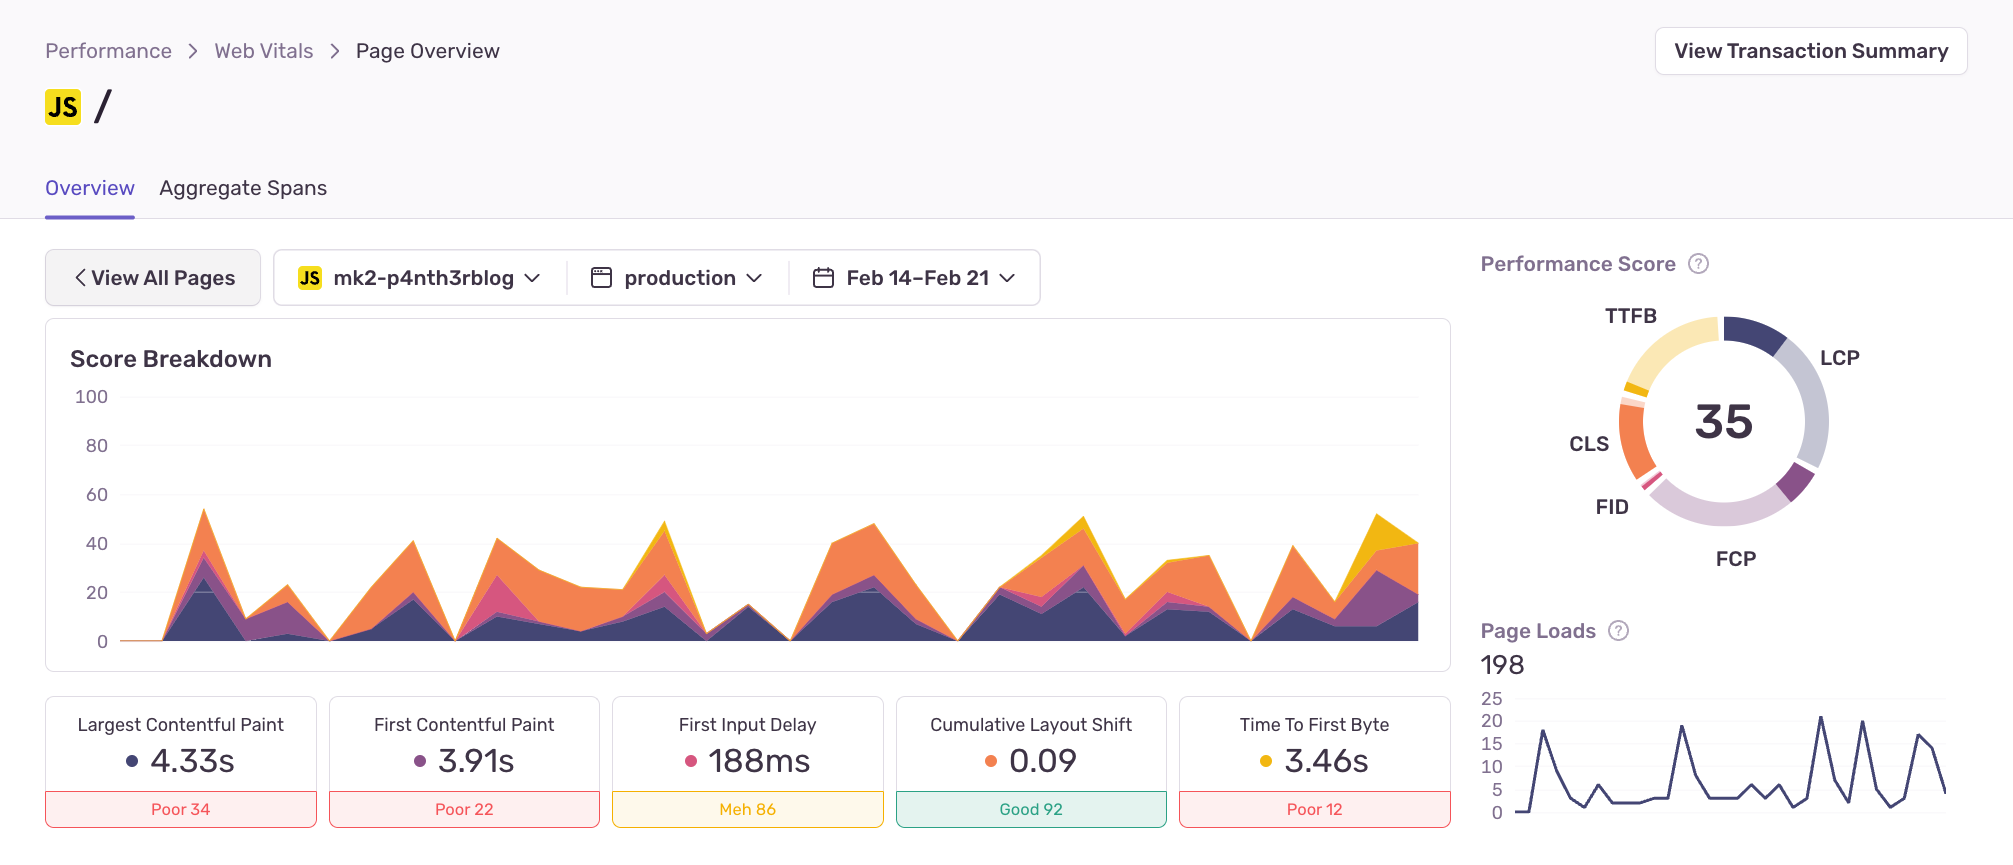
The most urgent thing that stood out to me to improve was the Time to First Byte (TTFB). TTFB refers to the time it takes for a browser to receive the first byte of response after it made a request to the server. Theoretically, the lower the TTFB, the sooner the browser can start painting the page, and the sooner users will see something in the browser, making them less likely to bounce away.
The TTFB value displayed here is for the 75th percentile (p75), meaning that 3.46s was the worst score found across 75% of all homepage views. This also means that 25% of users were waiting for longer than 3.46 seconds for the page to load. This poor score indicated that there was too much processing happening on the server before the response could be sent back. Here’s what was happening.
For some time, I had been using two separate middleware functions (or Edge Functions) at request time: one to fetch data from my newsletter provider to get the latest number of subscribers, and one to fetch data from the Twitch API to show my latest stream video, or the latest thumbnail from a current live stream in progress. Both functions would grab the initial HTTP response in memory, fetch some data from a third-party API, and rewrite the HTML accordingly.
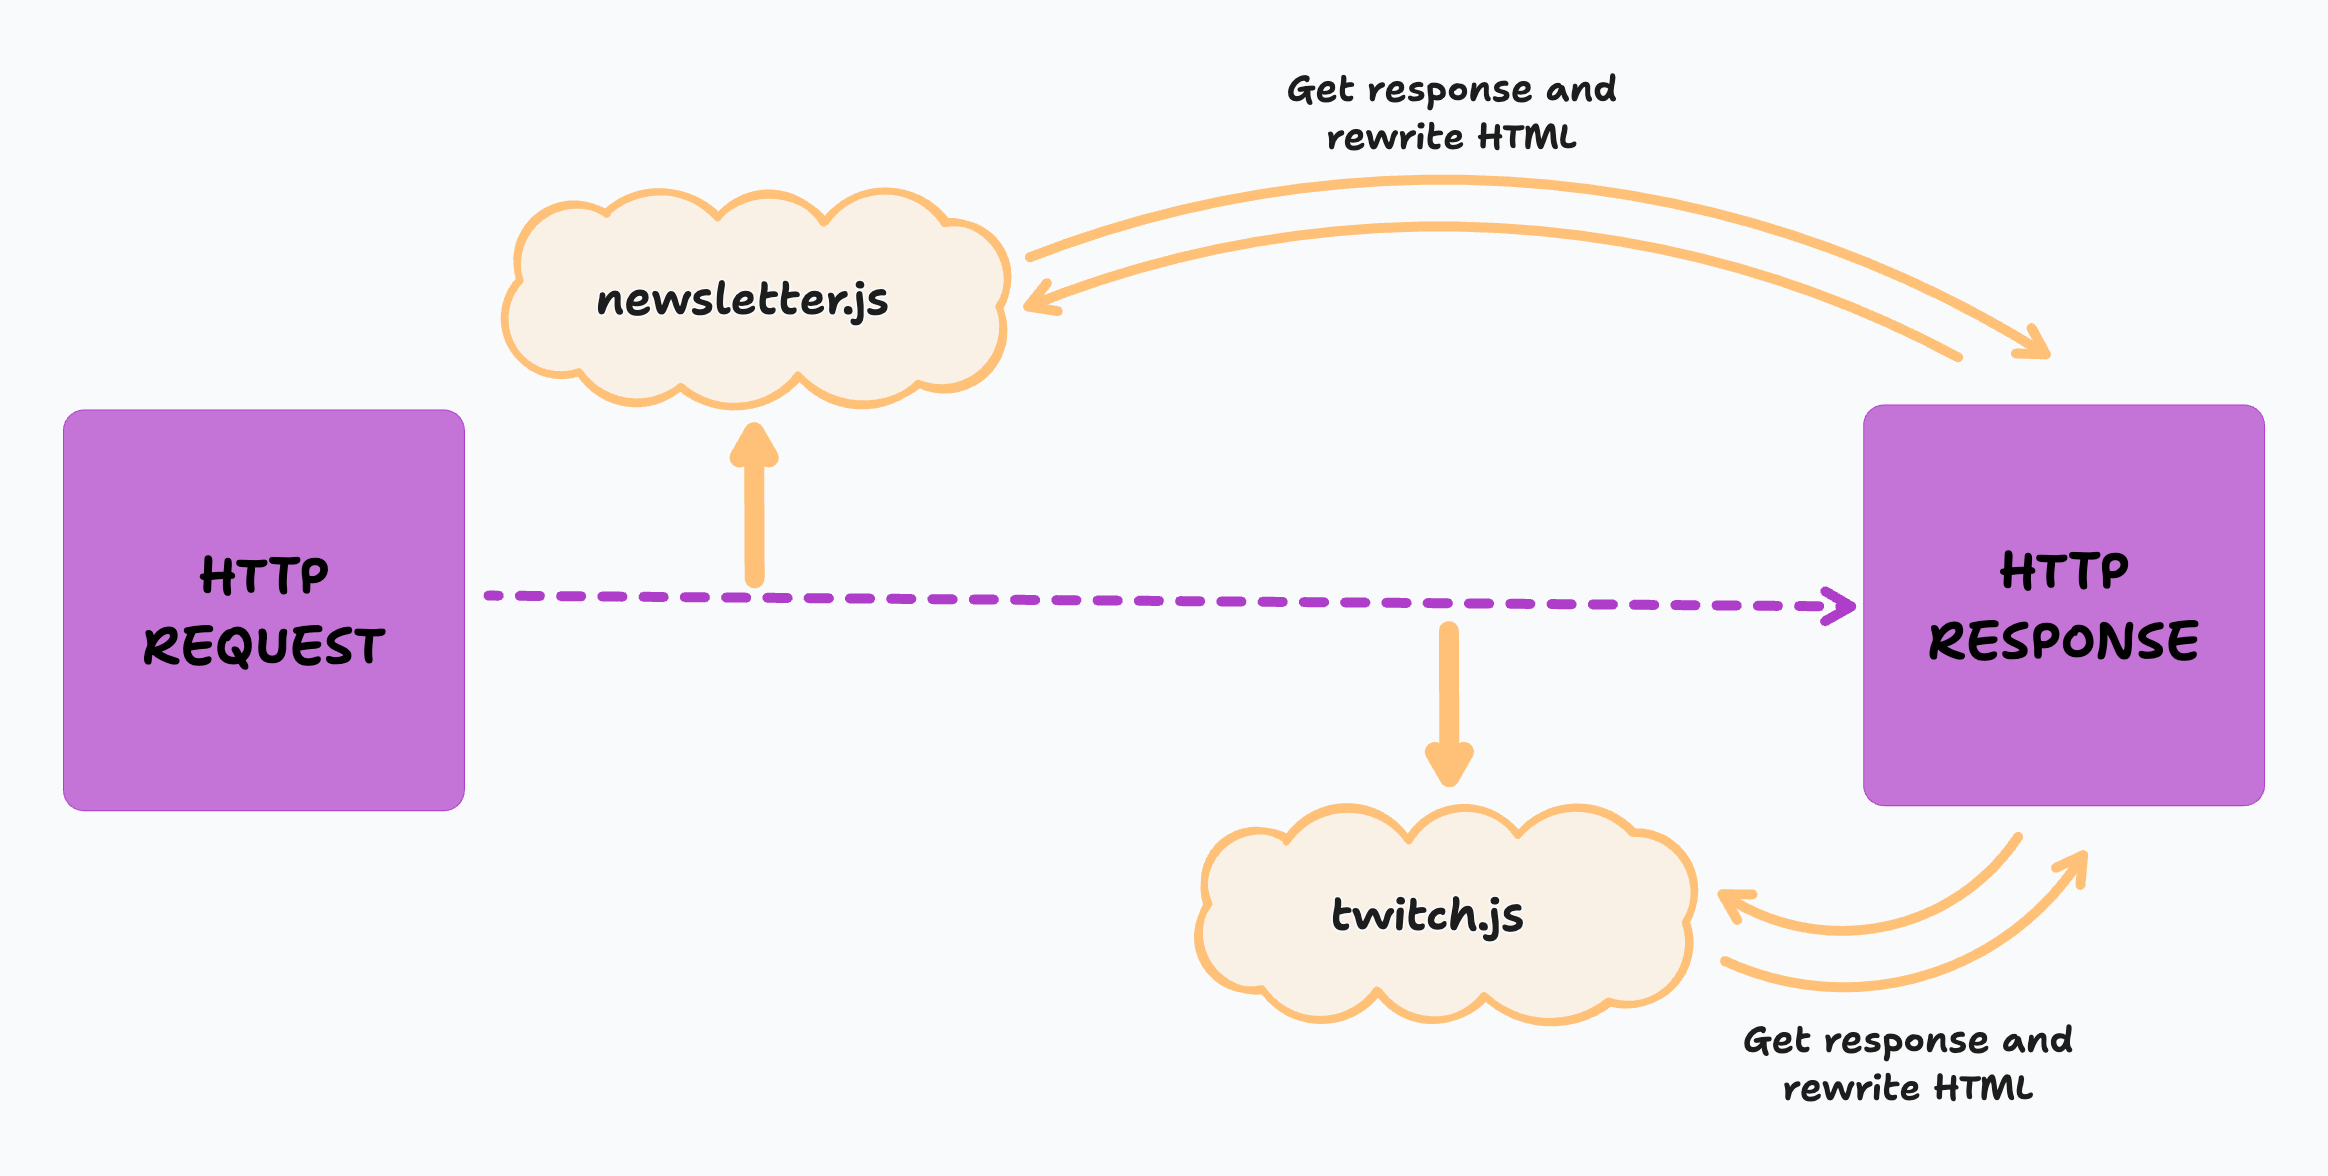
The aim of this architecture was to minimize client-side data-fetching which could block the main JavaScript thread to show some dynamic data on a statically generated homepage (and I hate skeleton loaders). This was great from a "show the user the most up to date thing" point of view, but the downsides of this is that it effectively duplicated the HTTP request and therefore doubled the time it took to show something in the browser. Add on top of this the varying API latency from two separate third-party services in static regions being called from anywhere in the world (the edge) and you start getting into a bit of a mess.
Plus, what use did the accurate newsletter subscriber number provide to anyone except me? And why did I really need to show the latest randomly generated stream thumbnail, especially given that most of the time it was a very unflattering image of me trying to work out how to code? People aren’t sitting in front of my homepage and refreshing it every few minutes to get an updated Twitch thumbnail. I had gone too far.
Approximating data is fine, actually
My priority at this point was to focus on improving the TTFB. The first step was straightforward: remove the Edge Function that fetched the number of newsletter subscribers, and instead fetch the data at build time and generate it statically. The number won’t be up to date until I do a rebuild, but we can account for small inaccuracies by adding a plus symbol to the number, or returning a string to approximate the number if the API call errors at build time.

function getNewsletterSubscribers() {
  let subscribers;

  try {
    const response = await fetch(
      "https://api.email-provider.com/subscribers",
      {
        headers: {
          //...
        },
      },
    );

    const result = await response.json();
    subscribers = `${result.count.toString()}+`;
  } catch () {
    subscribers = "loads of";
  }

  return subscribers;
}
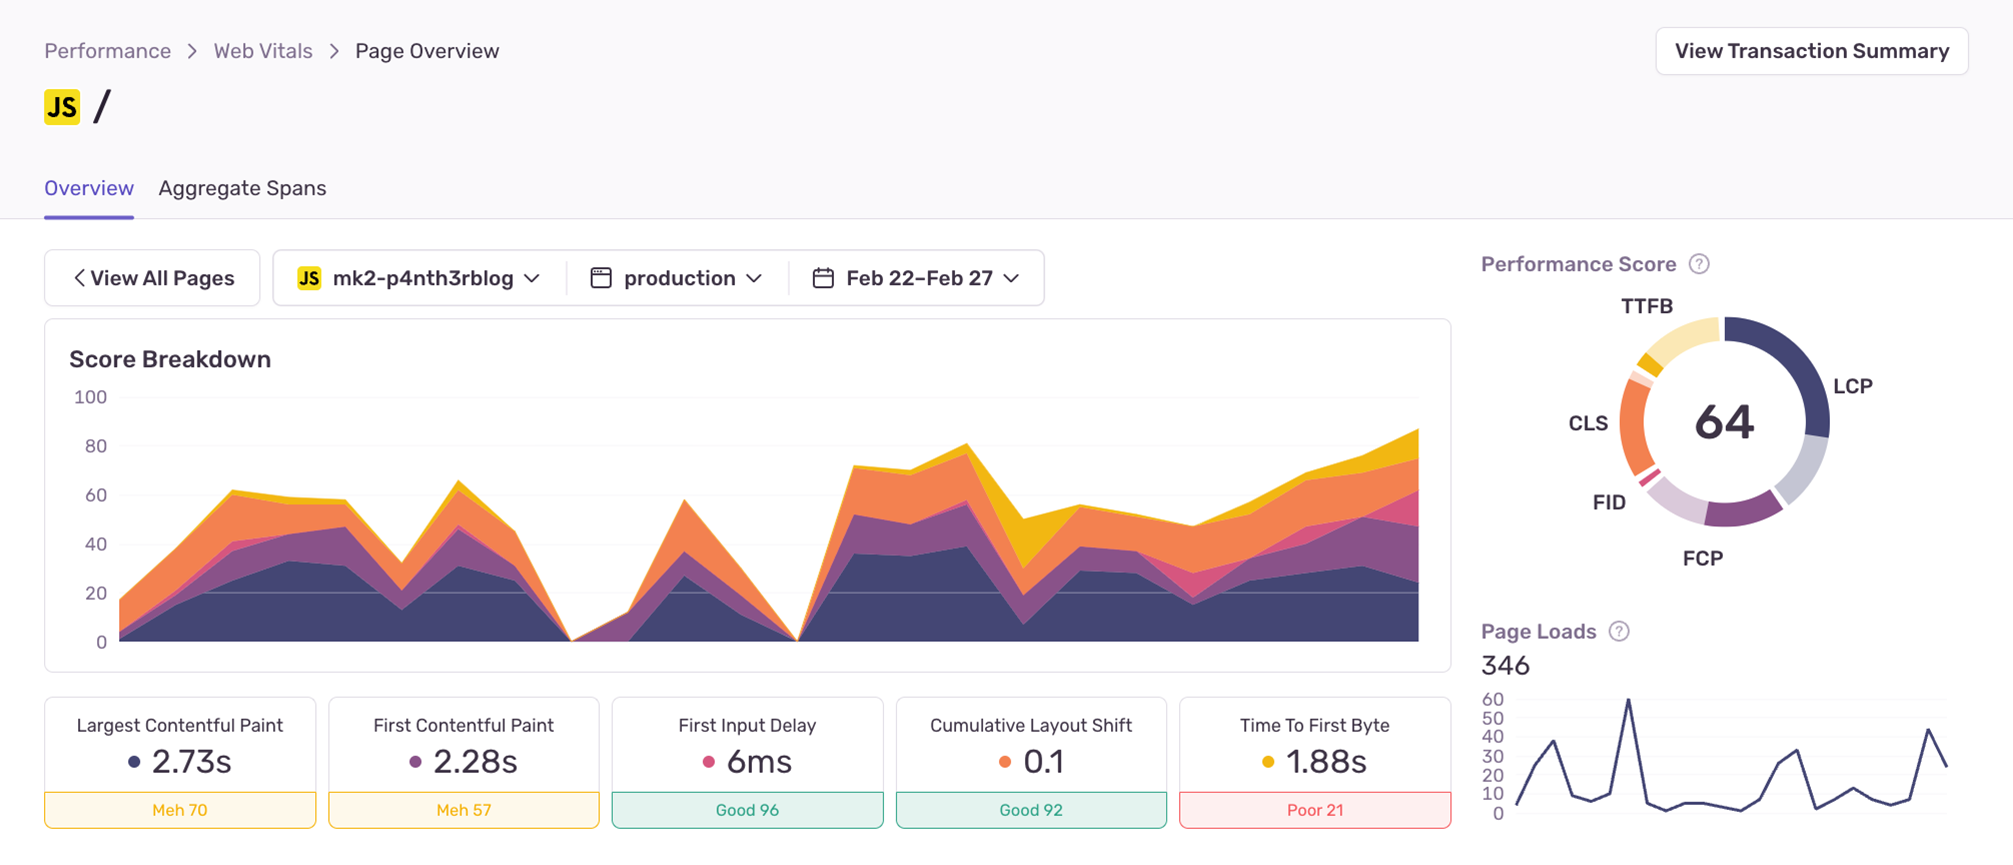
Removing just one Edge Function from the middleware chain improved the p75 TTFB greatly — and the difference was actually noticeable in the browser as a user loading the page. I monitored this single change for a week and the p75 value for TTFB had decreased from 3.46 seconds to just 1.88 seconds. This was a 46% decrease in how long it took for 75% of users to see something on my homepage in the browser. With one small change, all Core Web Vital scores had also improved.
The problem with moving data fetching from the server to the client
The next step was to remove the Edge Function that fetched the Twitch data. My hypothesis was that moving this to the client and writing the data to the DOM when it was ready would improve the perceived performance of the page for users — even if the data wasn’t all there yet. Without the middleware intercepting the HTTP request, the TTFB would reduce, and users would see something in the browser sooner.
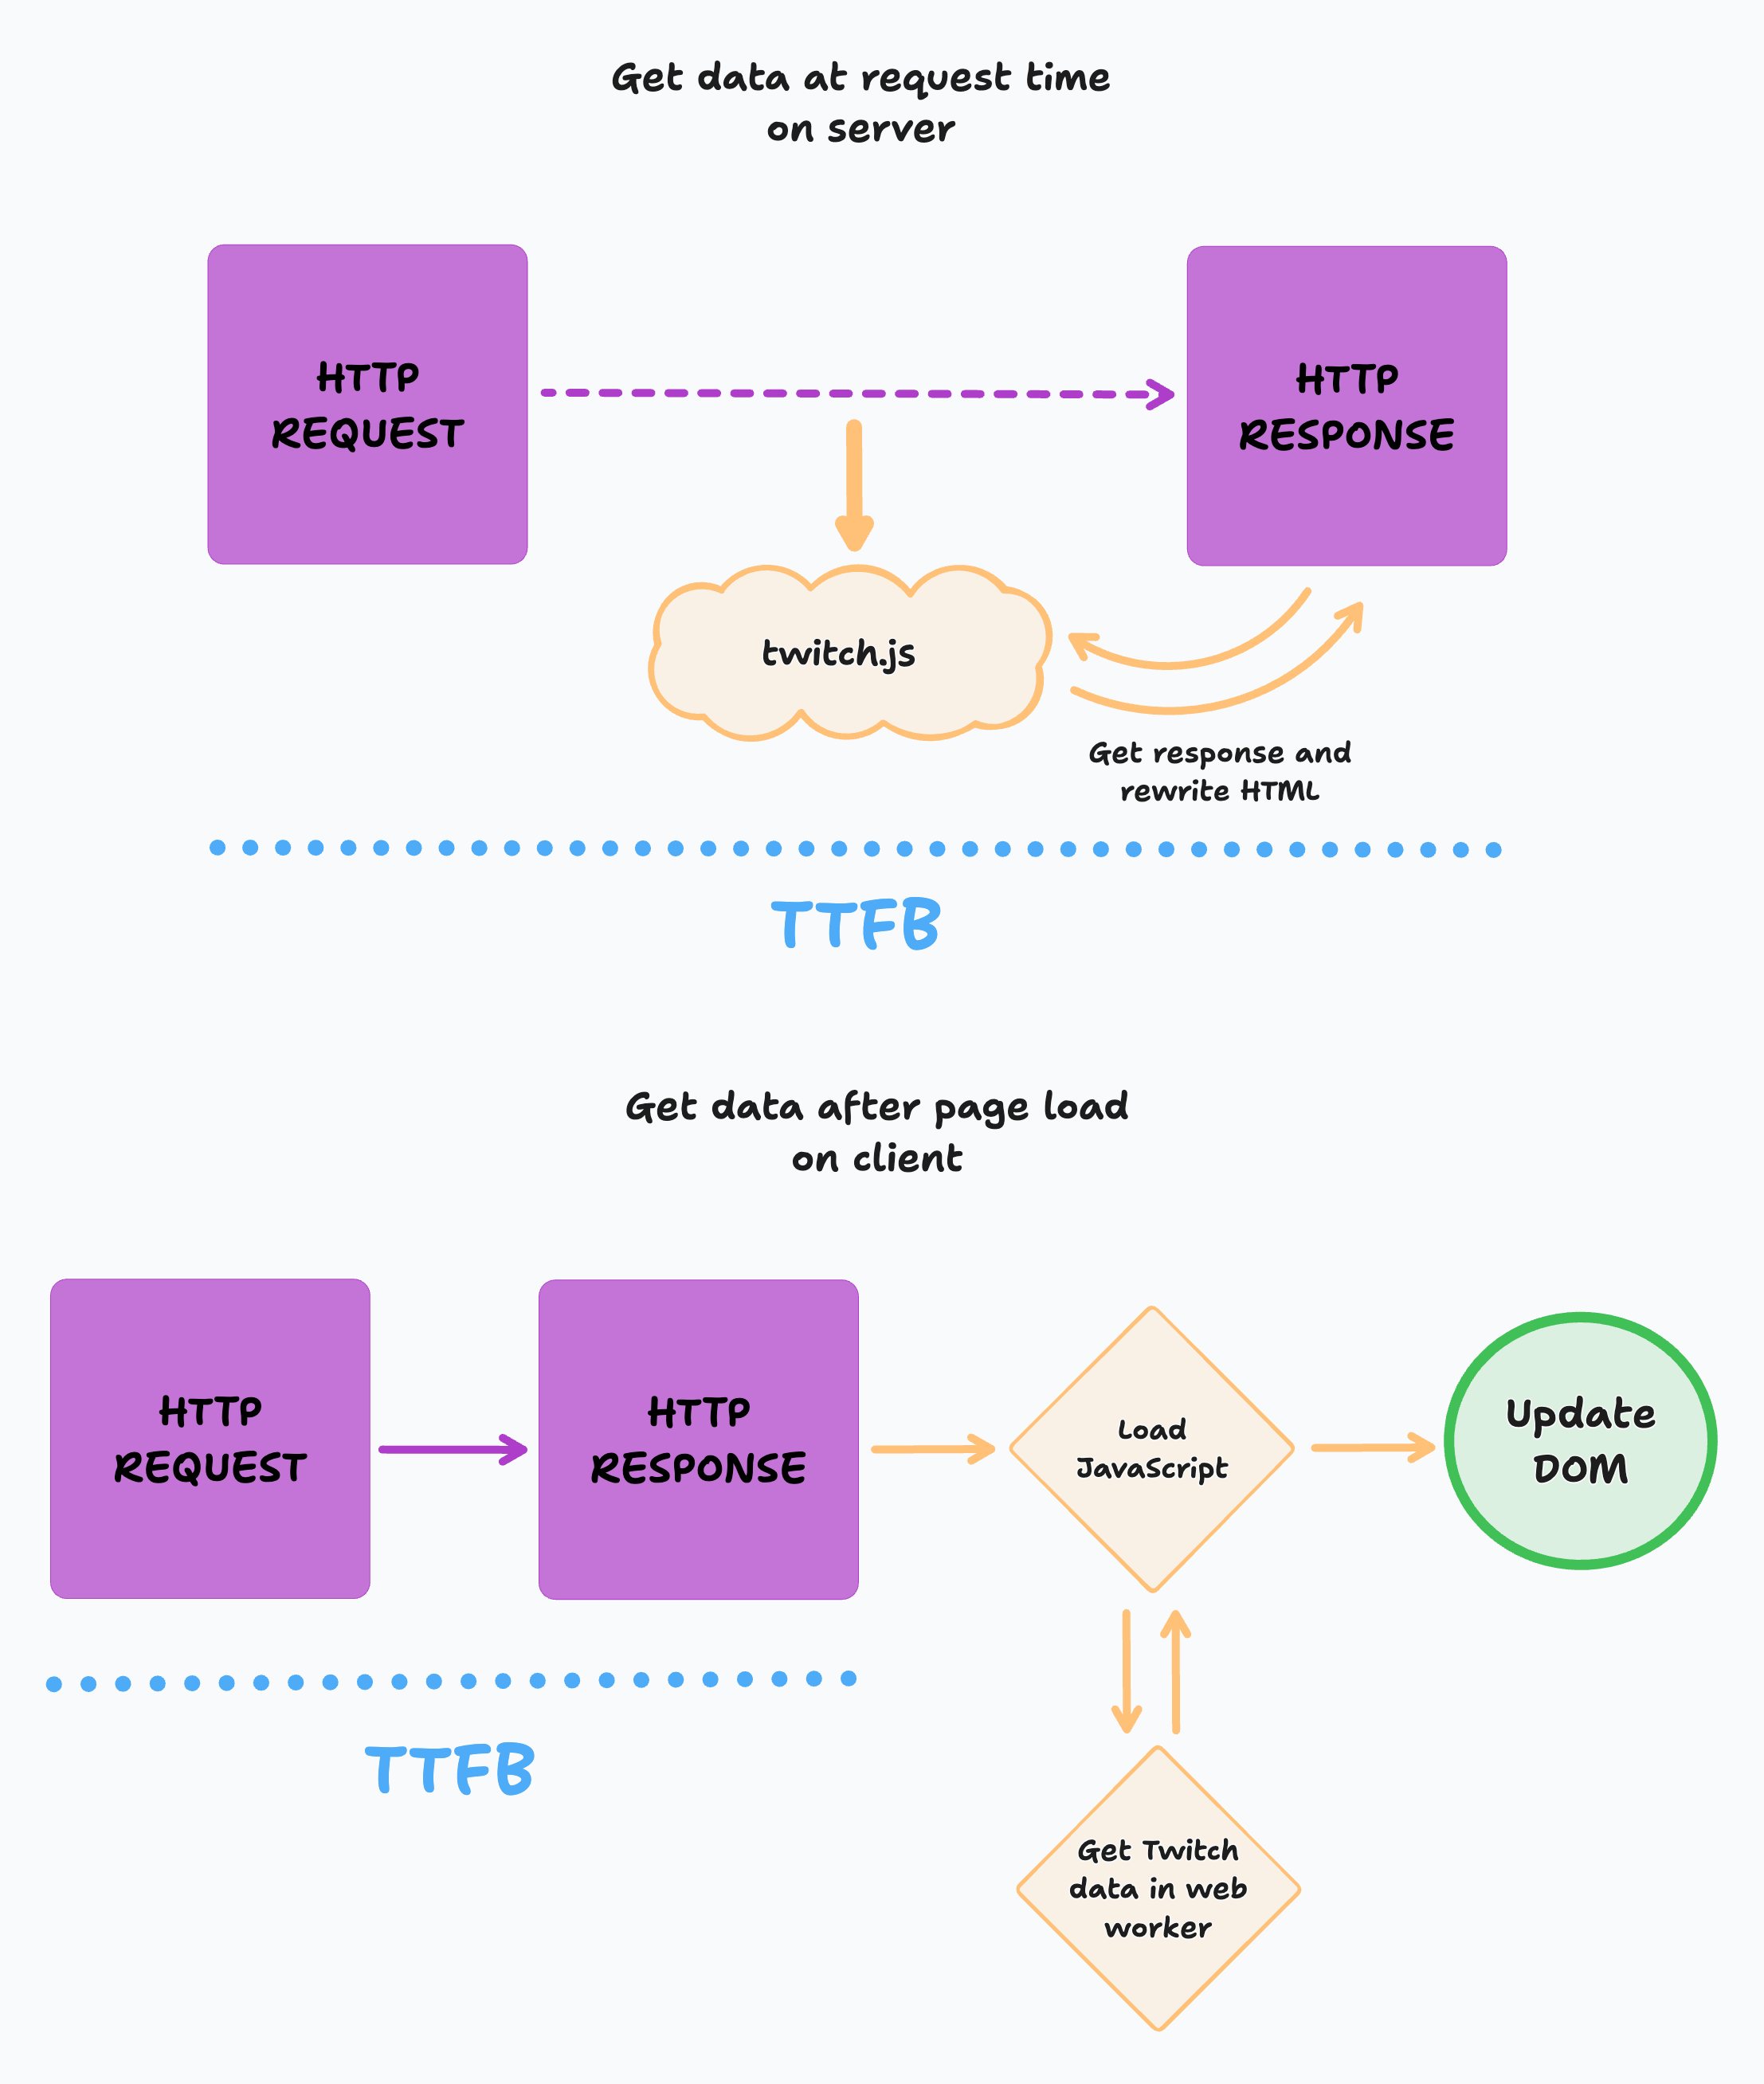
First, I moved the Twitch data fetching from the server to a client-side web worker, to avoid introducing new render-blocking behavior on the main thread. However, whilst the TTFB did indeed decrease, Cumulative Layout Shift (CLS) became a problem. (I also could have opted to load the JavaScript as an async deferred script but the visual results would have been the same.)
There are always tradeoffs to make when improving site performance, specifically with regards to Core Web Vitals. When you make improvements in one metric, you may end up sacrificing the score of another. Fetching the data and updating the DOM after the page had loaded meant that the Twitch stream thumbnail loaded up to a second later in my dev environment, causing the page content to shift. This could be even longer for real users. Layout shifts usually happen when the element’s size is not defined in the initial HTML or CSS. There are ways to get around this, such as by including a placeholder image of the same size (with height and width specified on the element) that is later replaced by the fetched image, but in my opinion this is also not a good experience, especially on slower internet connections. At this point, I had moved one performance problem from the server and created a new performance problem in the client.
It was time to make my website as static as possible again — but this approach still came with some tradeoffs.
Making sensible tradeoffs to reduce TTFB
When I rebuilt my website two years ago, I made a deliberate decision to build it as a static site using as little client-side JavaScript as possible, and the simple no-nonsense design of the site took this into account. My website has always been designed to be a marketing channel for my Twitch streams, and so I always want to include something about Twitch on the home page. When I first launched the website rebuild in 2022, I included a link to the next scheduled stream which was fetched and pre-generated at build time. Each time I went on or offline on Twitch, I used a webhook to rebuild the site to update it with new information. If you’re curious, here’s a snapshot of the website when it first launched.
To improve the TTFB without introducing new CLS, I made the homepage static again, rebuilding it using a webhook (in my Twitch bot application) each time I go on or offline on Twitch. If I’m not live on Twitch, the page is statically generated with my latest stream thumbnail and information at build time. If I am live on Twitch, here’s where the performance tradeoffs come into play.
Instead of fetching data from the Twitch API at request time to get the latest live stream information, I now use the Twitch video player embed to show the current live stream. The downside to this is that the page loads some extra client-side JavaScript to show the player. However, given that I’m live streaming for around only six hours per week, I figured this was a good tradeoff. The rest of the time you get a super-fast static experience.

Here’s a simplified view of the code for the Twitch component (which is a JavaScript function that builds static HTML) on my homepage for completeness. The isLive and vodData parameters are fetched at build time from the Twitch API.

function TwitchInfo({ isLive, vodData }) {
  return `
  ${
    !isLive
      ? `<a href="${vodData.link}">
           <p>${vodData.title}</p>
           <p>${vodData.subtitle}</p>
          <img
            src="${vodData.thumbnail.url}"
            alt="Auto-generated stream screenshot."
            height="${vodData.thumbnail.height}"
            width="${vodData.thumbnail.width}"
          />
        </a>`
      : `<div id="twitch-embed"></div>
      <script src="https://embed.twitch.tv/embed/v1.js"></script>
      <script>
        new Twitch.Embed("twitch-embed", {/* options */});
    </script>`
  }
  `;
}
Improving performance is a balancing act
Ultimately, you may have to make some compromises in order to make performance gains. By deciding that it’s acceptable to show inaccurate data and load some extra JavaScript for a few hours per week, I’ve improved the Core Web Vitals scores massively on my homepage, which is the most visited page on my site. Inaccurate data might not be appropriate for every website and app — but it’s something to consider when balancing performance improvements.
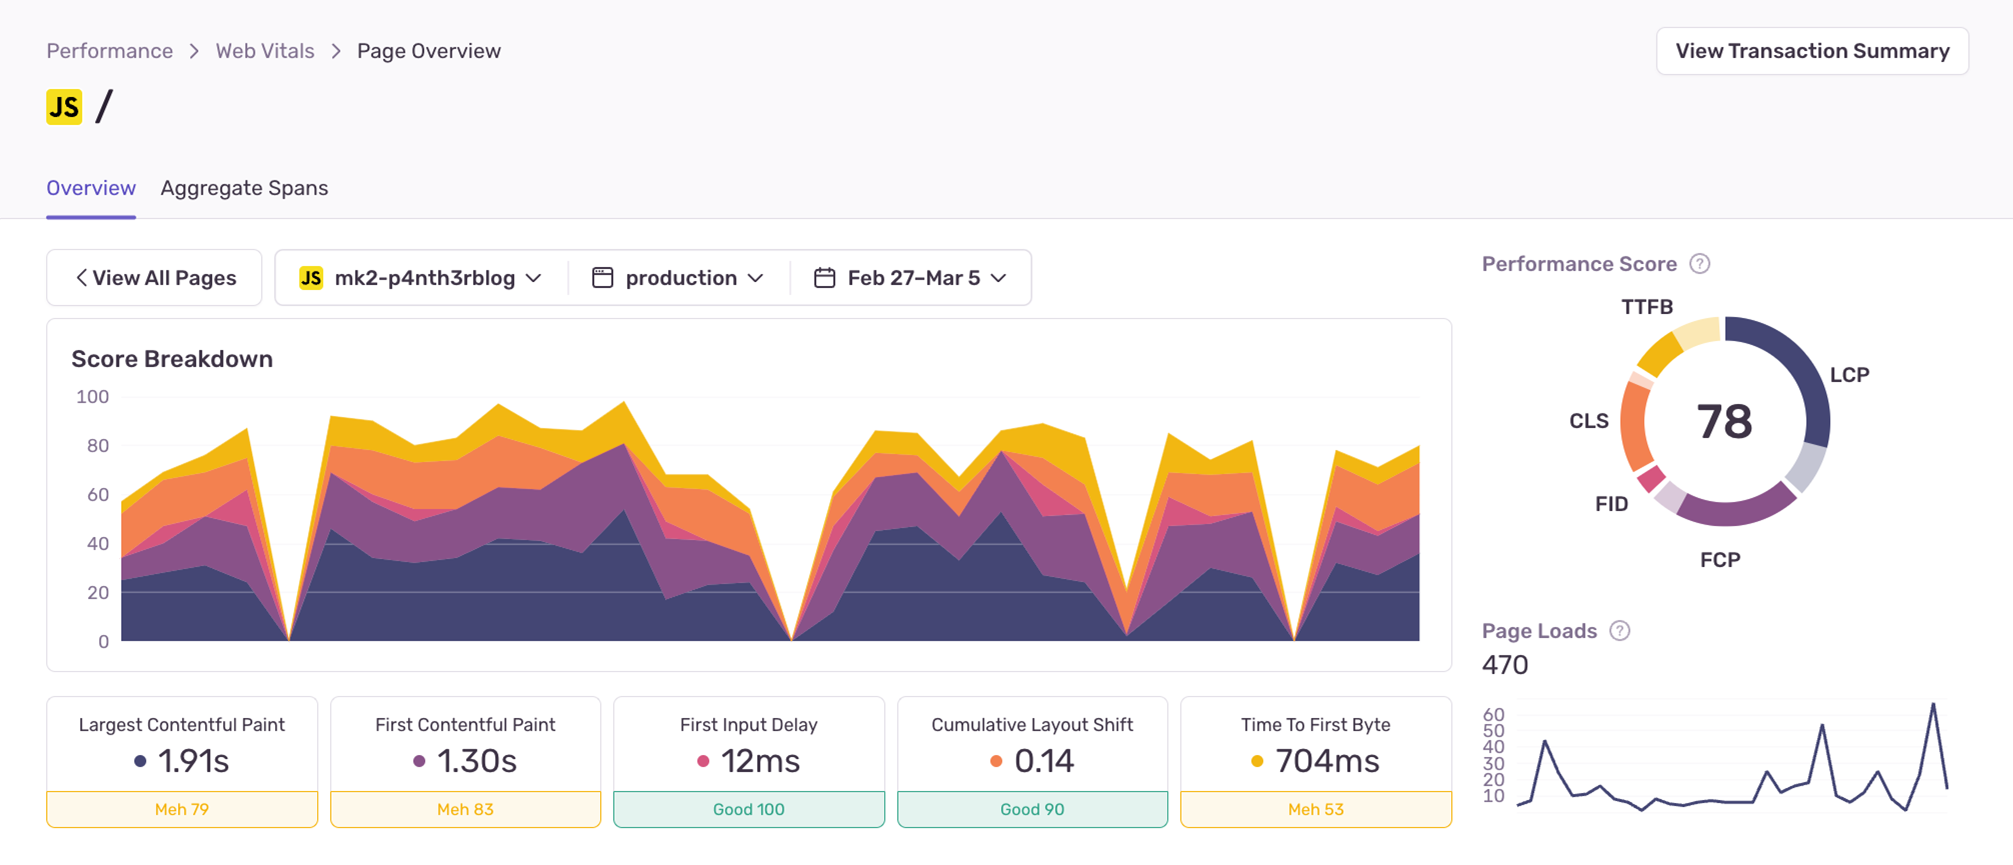
After removing both Edge Functions that ran on my homepage, and returning to a completely static build, I reduced the p75 TTFB by 80% to just 704ms. Whilst 25% of users are still experiencing a TTFB of over 704ms, 75% of my users see a page loaded in under 704ms. I’m really happy with the progress so far. If this isn’t a glorious advertisement for static sites and in turn, static site generators, I don’t know what is.
I’ve still got some further optimizations to make on the homepage, such as some local image optimizations (such as serving images in avif and webp formats where supported), rendering the webring component that loads in third-party JavaScript statically, optimizing font files (because there’s a huge fancy font file I load in to use only three characters as background textures), and perhaps addressing the render-blocking single CSS file.
As my good friend Cassidy Williams says: “Your websites start fast until you add too much to make them slow.”

