Using hooks to monitor and error track with Sentry when self-hosting Directus
If you self-host Directus, it becomes your responsibility to ensure your project is running smoothly. Part of this is knowing when things are going wrong so you can triage issues, fix errors, and get on with your day.
This is where Sentry comes in. Sentry is an error tracking and performance monitoring platform built for developers. With Sentry you can track and triage issues, warnings and crashes, and see issues replayed as they happened. Additionally, you can use Sentry to quickly identify performance issues, and dive deep into the stack trace and breadcrumb trails that led to an error. Sentry is also Open Source, and supports a broad spectrum of programming languages and platforms via official SDKs.
In this post, we’ll create a hook extension to set up Sentry error tracking on both the APIs that Directus generates, and the Data Studio applications.
Set up a new Directus project for extensions development
If you’re not already signed up to Sentry, create a free account. Before we can get to the fun part, we’ll need to create a Directus project for extensions development. To do that:
Install Docker
Create a new directory, for example
directus-self-hostedAt the root of the new directory, create the following
docker-compose.ymlfile, replacing theKEYandSECRETwith random values.
Head on over to Sentry and set up two new projects — one for your back end project (Node.js), and one for the front end Directus Data Studio (Browser JavaScript).

version: '3'
services:
  directus:
    image: directus/directus:latest
    ports:
      - 8055:8055
    volumes:
      - ./database:/directus/database
      - ./uploads:/directus/uploads
      - ./extensions:/directus/extensions
    environment:
      KEY: 'replace-with-random-value'
      SECRET: 'replace-with-random-value'
      ADMIN_EMAIL: 'test@example.com'
      ADMIN_PASSWORD: 'hunter2'
      DB_CLIENT: 'sqlite3'
      DB_FILENAME: '/directus/database/data.db'
      WEBSOCKETS_ENABLED: true
      EXTENSIONS_AUTO_RELOAD: true
      CONTENT_SECURITY_POLICY_DIRECTIVES__SCRIPT_SRC: "'self' 'unsafe-eval' https://js.sentry-cdn.com https://browser.sentry-cdn.com"
      SENTRY_DSN: 'replace-with-back end-project-dsn'
Head on over to Sentry and set up two new projects — one for your back end project (Node.js), and one for the front end Directus Data Studio (Browser JavaScript).
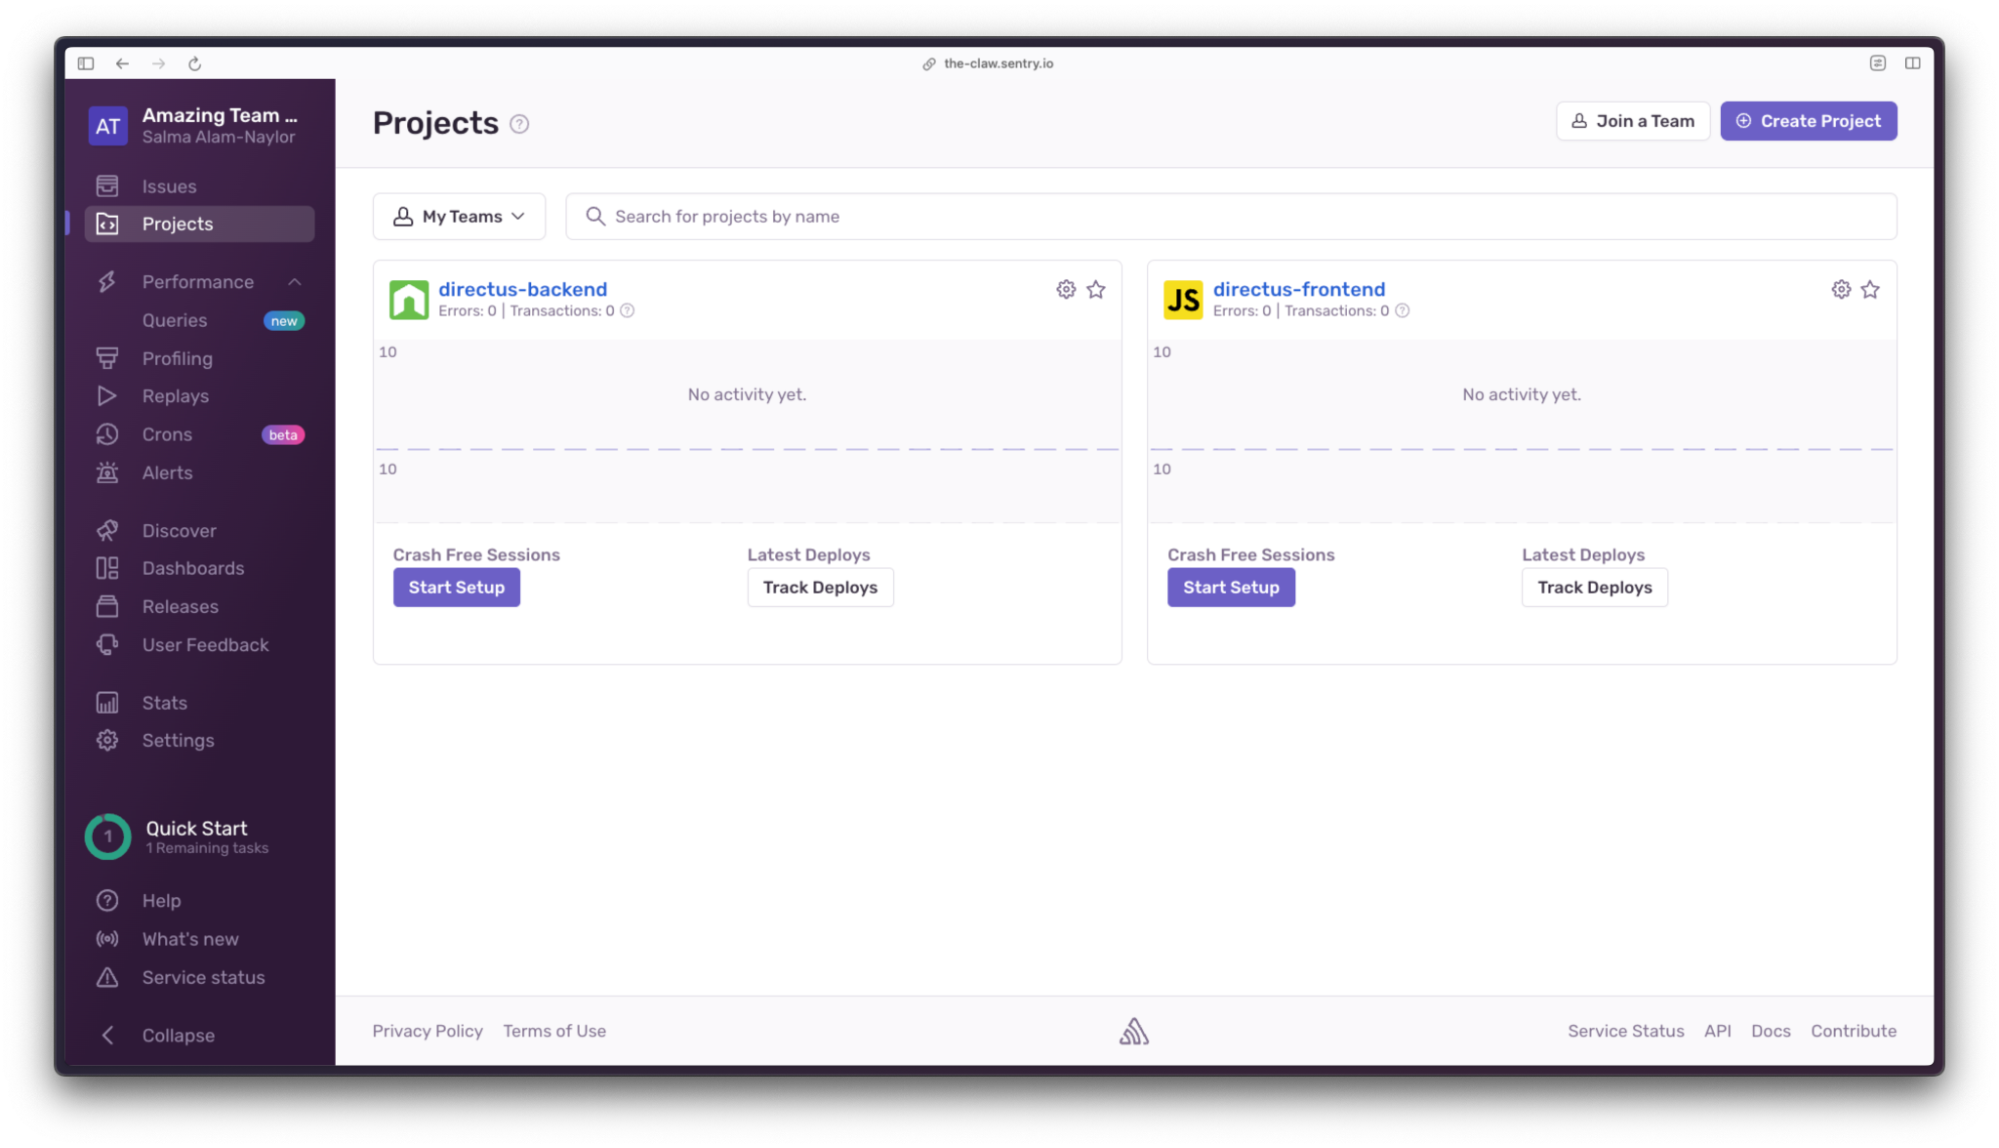
In Sentry, select your back end project, navigate to project settings, click on Client Keys (DSN), and copy the DSN (Data Source Name) value. Replace the SENTRY_DSN value in the docker-compose.yml file with the value from your Sentry project.
Next, make sure Docker is running on your machine, and run docker compose up at the root of your project directory. You’ll see that the following directories have been created for you:

directus-self-hosted
├ database
├ extensions
└ uploads
We’re going to create a Directus hook to be able to use Sentry in the back end application. In your terminal, navigate to the extensions directory, and run the following command with the following options to create the boilerplate code for your hook:

npx create-directus-extension@latest
├ extension type: hook
├ name: directus-extension-hook-sentry
└ language: javascript
Now the boilerplate has been created, navigate to the new hook directory, run the following command to install the Sentry Node.js SDK, and then open the directory in your code editor:

cd directus-extension-hook-sentry
npm install @sentry/node
Open index.js inside the src directory and delete the boilerplate. We’re ready to build the hook extension.
Understanding hooks in Directus
Custom API Hooks allow you to inject logic when specific events occur within your Directus project. These events include creating, updating, and deleting items in a collection, on a schedule, and at several points during Directus' startup process.
For this extension project, we'll use the init hooks to monitor the API by registering Sentry's requestHandler. For error tracking in the front end Data Studio application, we’ll use the embed method to inject custom JavaScript needed to track front end events in Sentry.
Monitor the Directus API using the Sentry Node SDK
Copy and paste the following code to the index.js file in your new hook directory. This imports the Sentry SDK, creates the initial export, and initializes the SDK. Due to how the Sentry SDK is built and the fact that Directus extensions are exclusively ES Modules, we need to use createRequire from the node:module API:

import { createRequire } from "module";
const require = createRequire(import.meta.url);
const Sentry = require('@sentry/node');

export default ({ init }, { env }) => {
	Sentry.init({
 		dsn: env.SENTRY_DSN,
		tracesSampleRate: 1.0
	});
};
The first parameter of the default export makes the Directus init method available — this is used to define new init event types. In the Sentry initialization method, we’re passing in the DSN we defined in the docker-compose.yml file and the tracesSampleRate. The tracesSampleRate controls how many transactions arrive at Sentry and takes a value from 0.0 to 1.0 (from 0% to 100%). Whilst it may be useful to use a tracesSampleRate of 1.0 during testing, it is generally recommended to reduce this number in production.
To start monitoring your back end application with Sentry, add two init hooks below the Sentry initialization. Under the hood, Directus uses Express for API routing. On routes.before we’re adding the Sentry requestHandler, which must be the first middleware registered on the app. On routes.custom.after, we’re adding the Sentry errorHandler, which must be registered before any other error middleware, and after all controllers.
If you’d like more context about this implementation, you can read more about the Sentry Express SDK in the Sentry documentation.

import { createRequire } from "module";
const require = createRequire(import.meta.url);
const Sentry = require('@sentry/node');

export default ({ init }, { env }) => {
	Sentry.init({
 		dsn: env.SENTRY_DSN,
		tracesSampleRate: 1.0
	});

+	init('routes.before', ({ app }) => {
+		app.use(Sentry.Handlers.requestHandler());
+		console.log('-- Sentry Request Handler Added --');
+	});
+
+	init('routes.custom.after', ({ app }) => {
+		app.use(Sentry.Handlers.errorHandler());
+		console.log('-- Sentry Error Handler Added --');
+	});
};
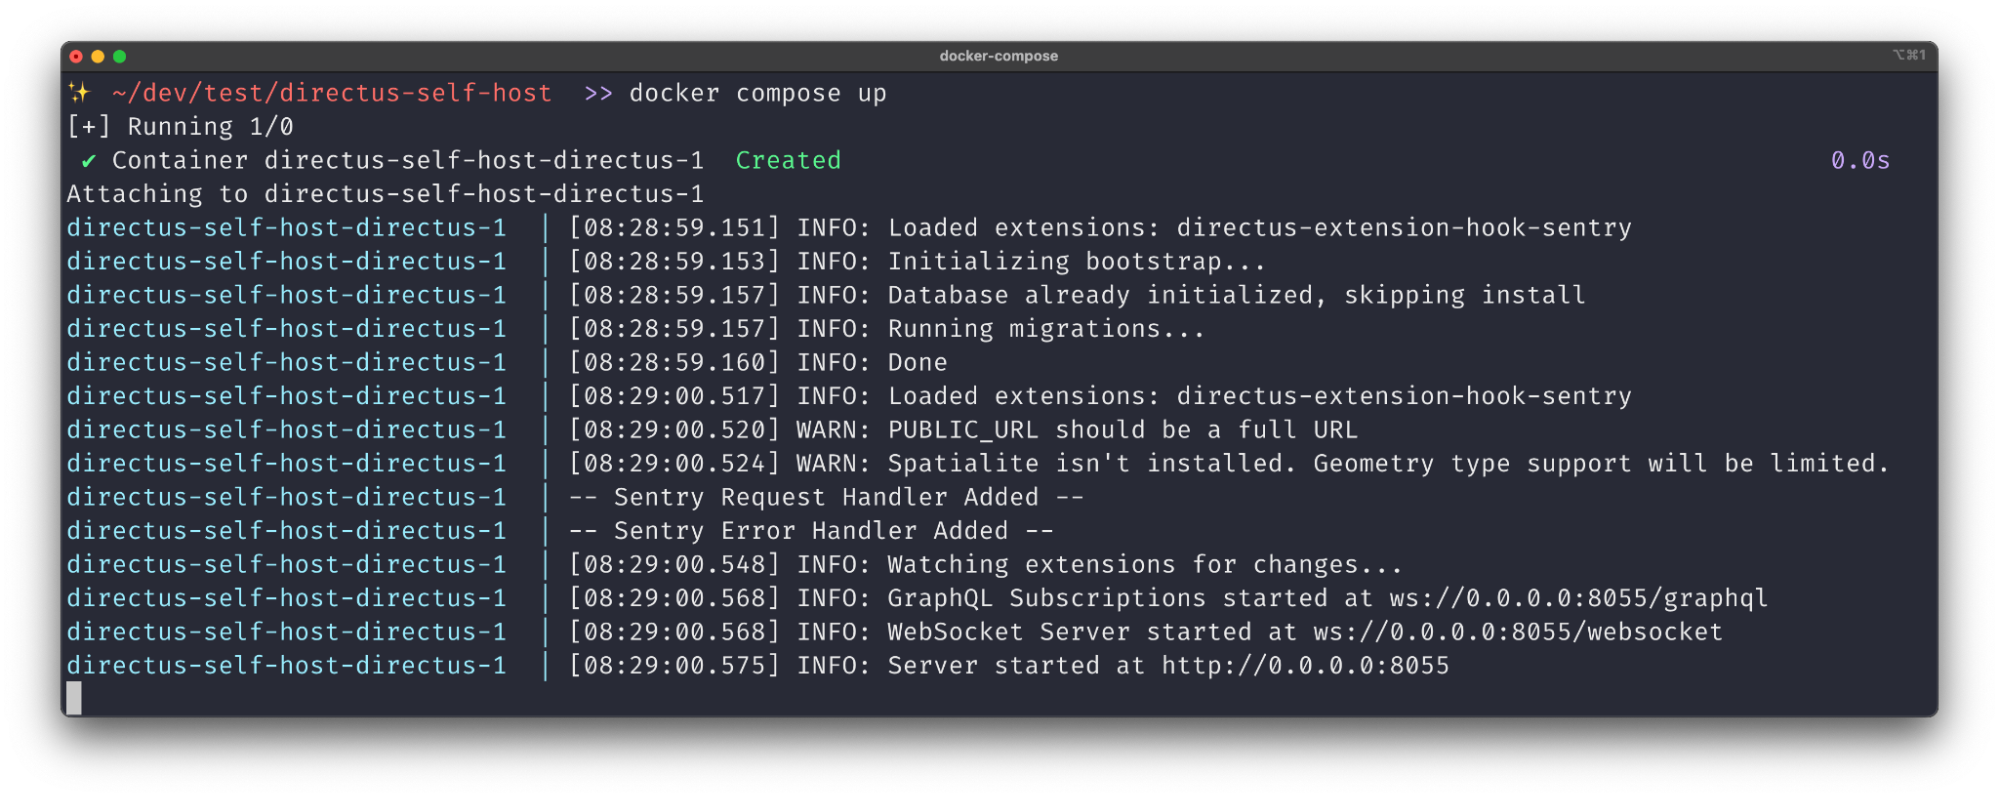
Next, let’s build the hook. In the directus-extension-hook-sentry directory, run npm run build. Restart the Directus Docker container, and you’ll see the two logs in your terminal.
Monitor the Directus Data Studio using the Sentry Loader Script
Next, we’re going to add Sentry monitoring to your front end application (Directus Data Studio). To do this, we’ll need to inject some custom JavaScript to the page, and we can do this using embed hook events. Embed hook events allow custom JavaScript and CSS to be added to the <head> and <body> within the Directus Data Studio.
Head over to Sentry, and navigate to the front end project you created earlier. Go to project settings, click on Loader Script, and copy the provided script tag code.
Back in the index.js file of your extension, make the embed method available in the exported function of the file:

- export default ({ init }, { env }) => {
+ export default ({ init, embed }, { env }) => {
Below the two init hooks you created to monitor the back end application, add a new embed hook. The first parameter head instructs the extension to embed something into the <head> of your Directus Data Studio Application, and the second parameter is the front end Loader Script you copied from Sentry just now:

embed(
	`head`,
	`<script src="your-front end-project-loader-script-url" crossorigin="anonymous"></script>`
);
Next, rebuild the extension with npm run build, restart Directus again, and you have successfully implemented full stack Sentry error tracking and monitoring to your Directus project.
Test your full stack setup
Let’s send some test errors to Sentry to make sure everything is hooked up.
Test back end error tracking
We’re going to create a test endpoint to trigger an error event in Sentry by creating a new Directus extension. Navigate to the extensions directory, and run the following command with the following options to generate some boilerplate code for the test endpoint:

npx create-directus-extension@latest
├ type: endpoint
├ name: directus-extension-endpoint-fail
└ language: javascript
You’ll now see a new directory, directus-extension-endpoint-fail in your extensions directory. Open the index.js file in the newly created directory and replace it with the following code, which will throw a new error intentionally.

export default {
  id: 'fail',
  handler: (router) => {
    router.get('/', (req, res) => {
      throw new Error('Intentional back end error for Sentry test');
        });
    }
};
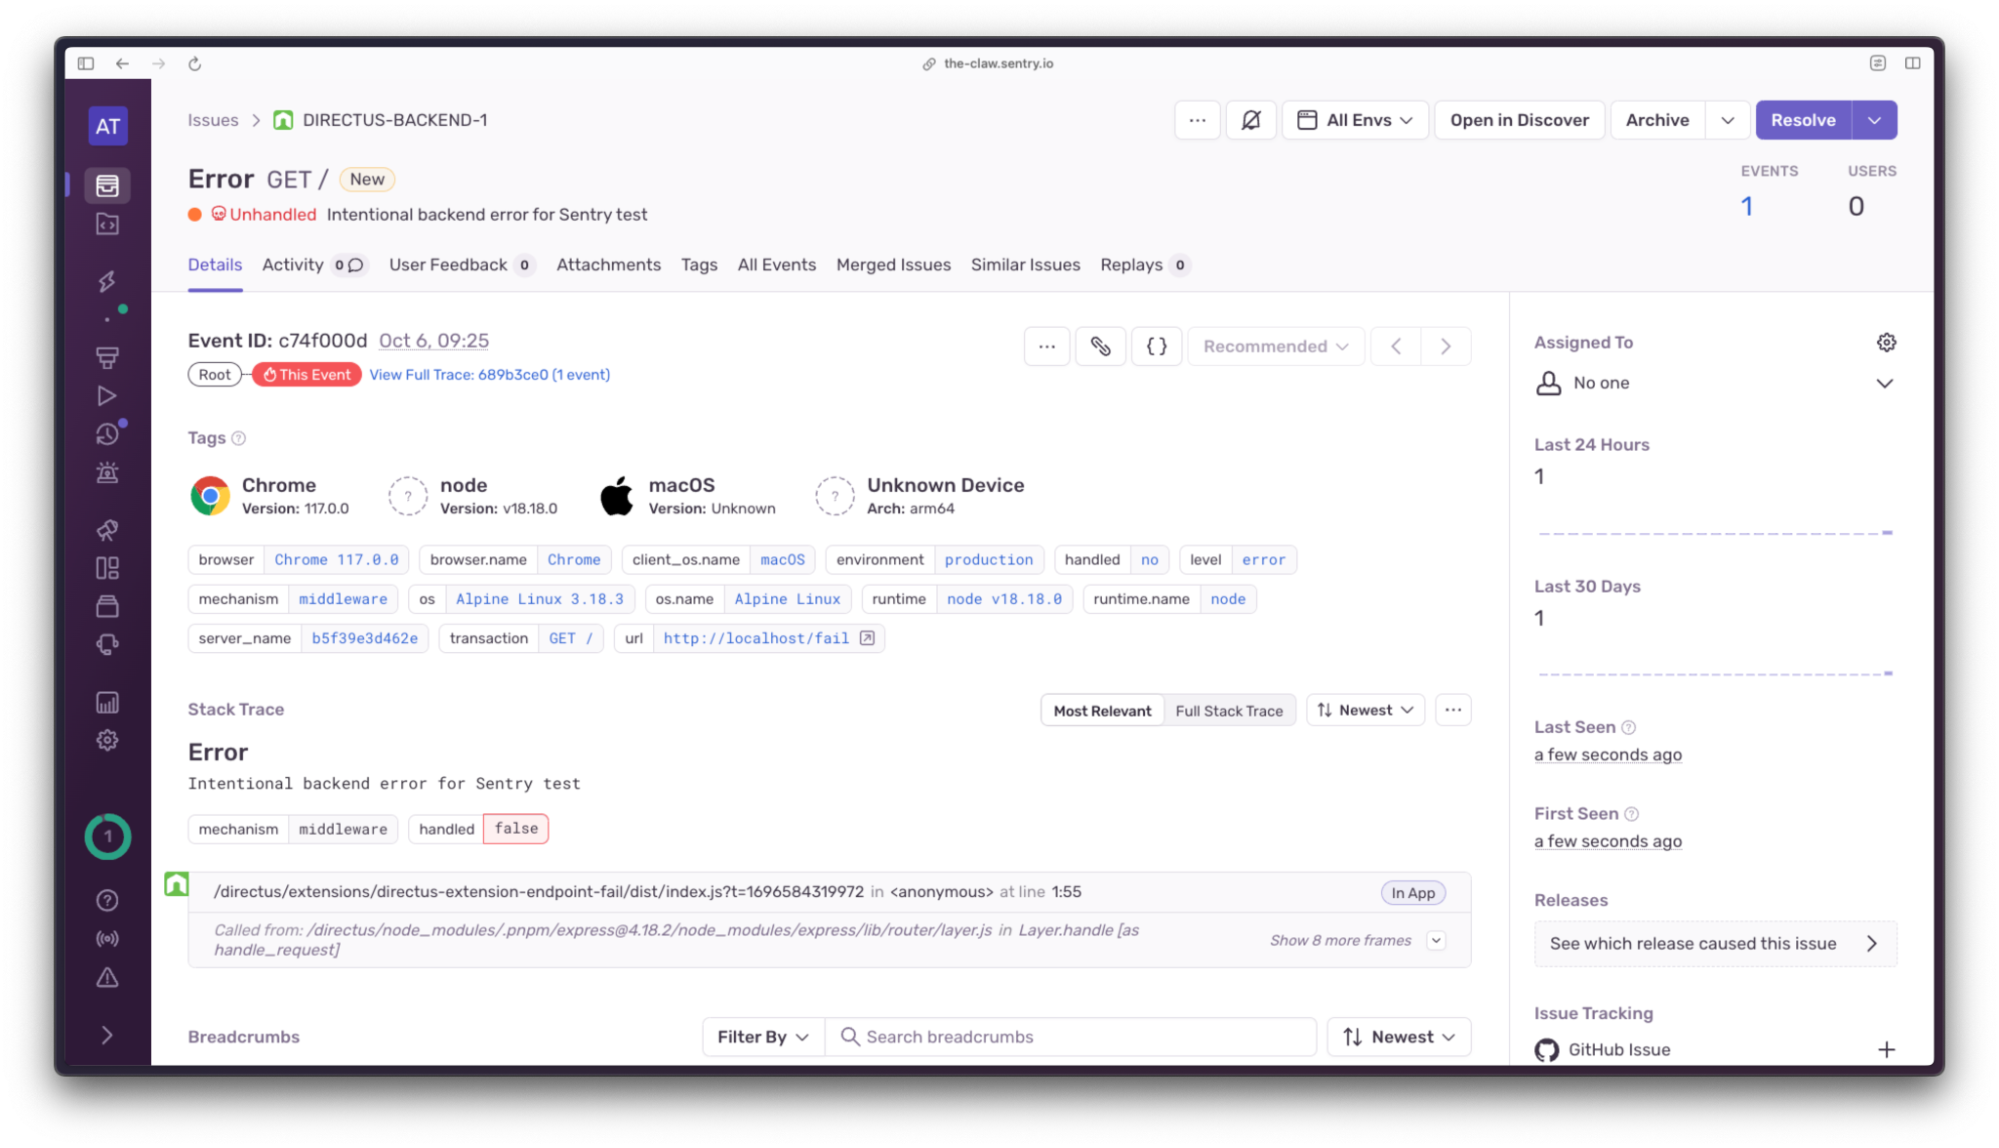
In the root of the new extension directory, run npm run build, restart the Directus Docker container again, and navigate to http://localhost:8055/fail in your browser. You will see an error message on the browser page, in the terminal, and in your back end project's Sentry issues list. Boom!
Test front end error tracking
Next, let’s confirm the front end Loader Script is tracking issues. Let’s create another extension to test an error in a front end template. Back in your Directus extensions directory, run the following command:

npx create-directus-extension@latest
├ type: module
├ name: directus-extension-module-fail
└ language: javascript
Open the newly created extension's module.vue file and replace it with the following code:

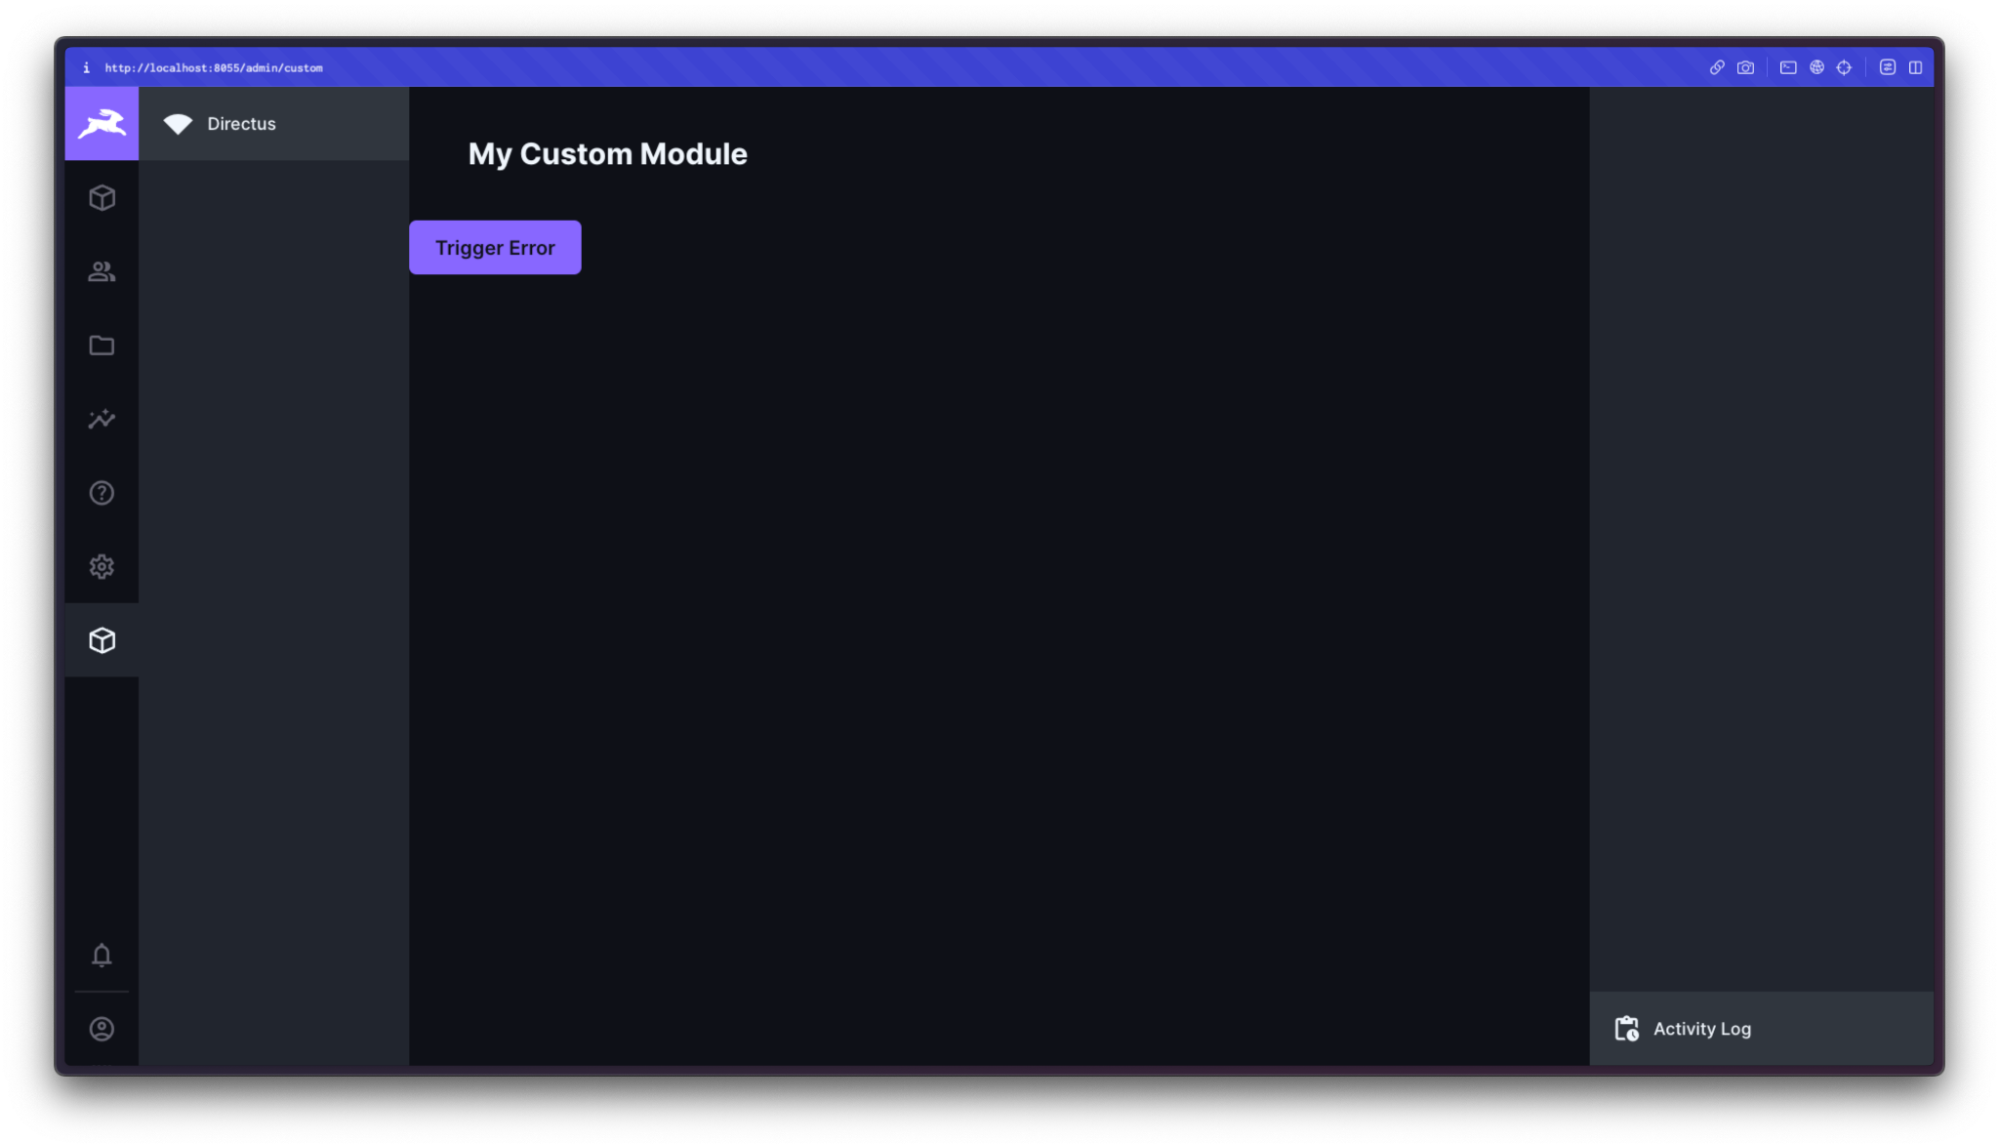
<template>
	<private-view title="My Custom Module">
		<v-button @click="triggerError">Trigger Error</v-button>
	</private-view>
</template>

<script>
export default {
	methods: {
		triggerError() {
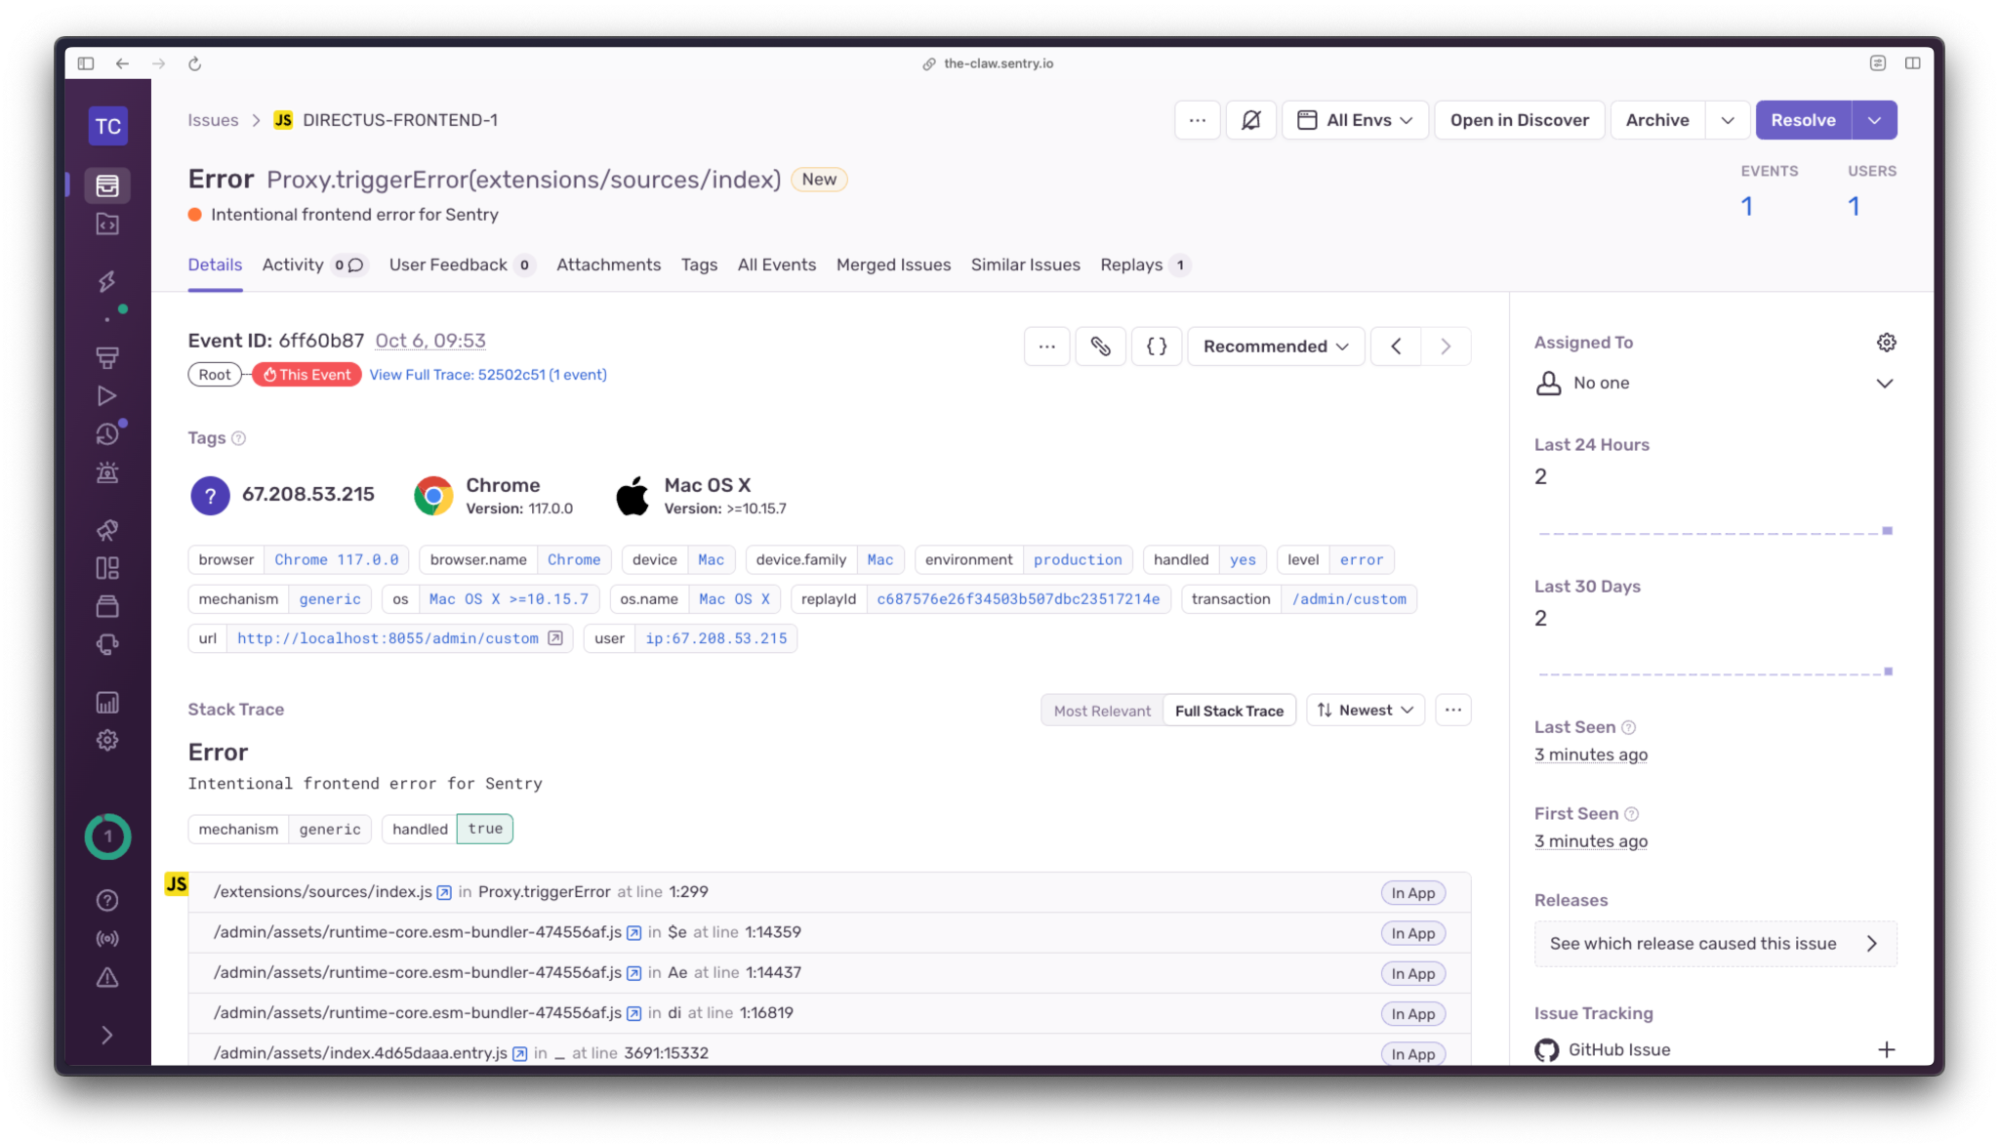
			const error = new Error('Intentional front end error for Sentry');
			Sentry.captureException(error);
		}
	}
};
</script>
From the extension directory, run npm run build, restart the Directus Docker container, and navigate to http://localhost:8055/admin/settings/project in your browser. Sign in to Directus using the credentials in your docker-compose.yml file. Scroll down to Modules, and check the checkbox to enable the new custom module. For reference, the name of the module is defined in the index.js file of the module extension.
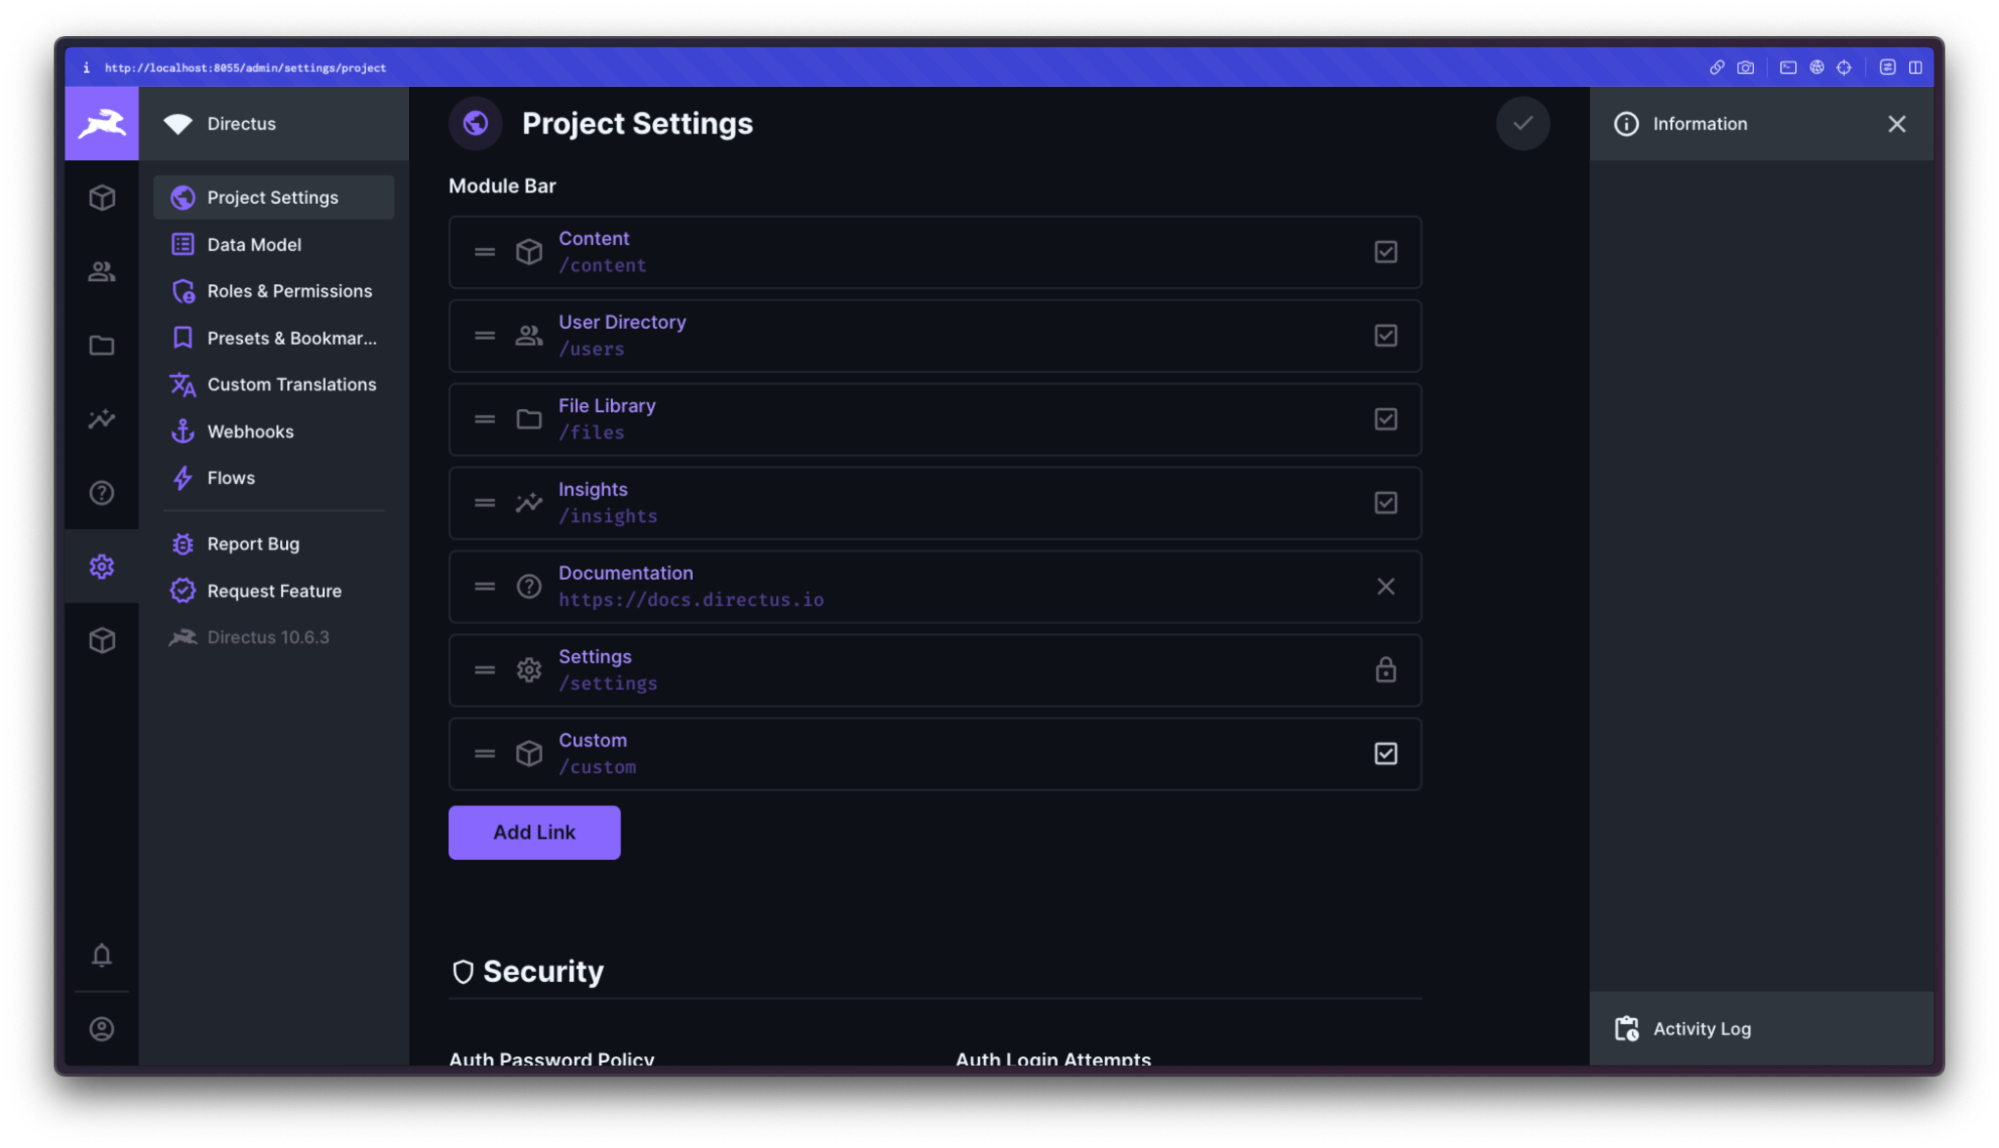
Navigate to the new custom module using the icon on the left menu bar, and click the Trigger Error button.
You’ll now see the error message in your front end project's Sentry issue list. We’re done!
Summary
If you’re self-hosting Directus, you need a reliable way to monitor, triage and be alerted to issues in your back end and front end applications. Sentry makes this possible and ensures you spend less time searching for clues, and more time fixing what’s broken. Additionally, you can configure Distributed Tracing with Sentry to provide a connected view of related errors and transactions by capturing interactions among your entire suite of Directus extensions and software applications.
Head over to the Sentry docs to learn about the wide range of language and platform support, and if you’re still not convinced, try out the Sentry Sandbox to explore the platform with a bucket load of pre-populated real-world data.
Originally posted on docs.directus.io
