How to make your web page faster before it even loads
As developers (and as front end developers in particular), we usually talk about web performance in the context of measuring what happens when we start to see things appear in a browser window, and when we can consume content or interact with the page. For example, the following Core Web Vitals guide the discussion on what we can see, use and experience:
First Contentful Paint (FCP), which measures the time from when the user first navigated to the page to when any part of the page’s content is rendered,
Largest Contentful Paint (LCP), which is the point in in the page load timeline when the main content of the page has likely loaded, and
Interaction to Next Paint (INP), which measures how quickly a web page responds to user input.
This makes sense given that without anything to consume and/or interact with we don’t really have an experience to measure at all, but what about the events that happen before the first byte of a web page is received by the browser? Can we measure those events, and subsequently optimize them to make our web pages and applications load even faster?
How pre-TTFB events are visualized in the Sentry Trace View
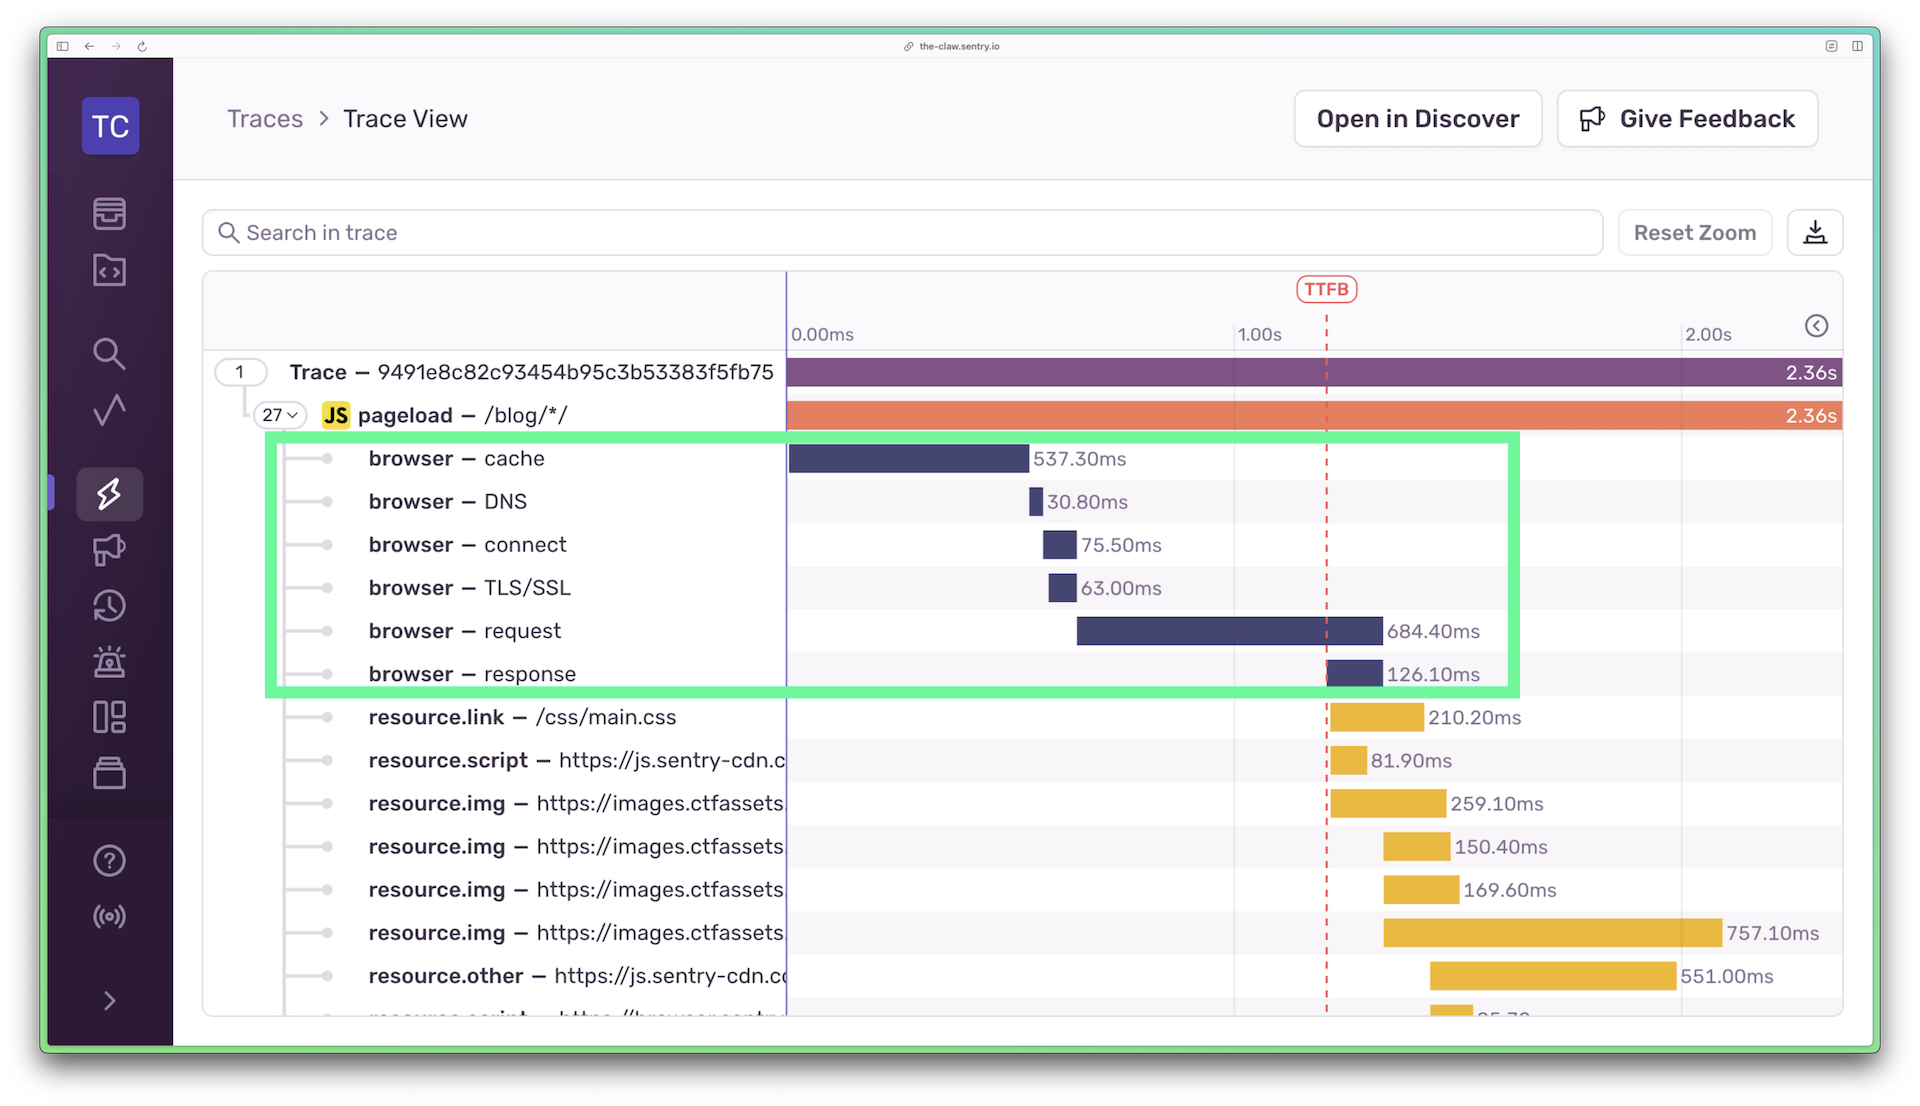
The above questions came to mind when looking at the Trace View in Sentry, where the events that happen before anything is rendered in a browser window are captured and labeled as browser spans. Six spans are registered in chronological order: cache, DNS, connect, TLS/SSL, request, and response. All events before response precede the Time to First Byte (TTFB), which measures the time between the request for a web page/resource and when the first byte of a response begins to arrive.

You may be wondering how these events are captured by Sentry, given Sentry won’t have been initialized in the browser at this point in the page load timeline; and I wondered the same thing! The answer lies in the Performance API — a group of web standards used to measure the performance of web applications — and more specifically the Navigation Timing API, which provides some very useful metrics including high-precision timestamps to the browser each time an event (known as a PerformanceEntry) happens.
The really cool thing is that you also have direct access to the Performance API in the browser: most of the performance entries are recorded for any web page without any setup or extra code needed to retrieve them. Try it out now by opening up the dev tools console and typing window.performance. You’ll see something like this (I’ve manually grouped related timestamps and ordered them for easier parsing):

// captured from https://whitep4nth3r.com on Tues 30 July @ 13.42
{
  "timing": {
    "navigationStart": 1722343304923,

    "redirectStart": 0,
    "redirectEnd": 0,

    "fetchStart": 1722343304928,

    "domainLookupStart": 1722343304928,
    "domainLookupEnd": 1722343304928,

    "connectStart": 1722343304928,
    "secureConnectionStart": 0,
    "connectEnd": 1722343304928

    "requestStart": 1722343304988,
    "responseStart": 1722343304989,

    "unloadEventStart": 0,
    "unloadEventEnd": 0,

    "responseEnd": 1722343304998,

    "domInteractive": 1722343305161,
    "domContentLoadedEventStart": 1722343305161,
    "domContentLoadedEventEnd": 1722343305161,
    "domLoading": 1722343304996,
    "domComplete": 1722343305381,

    "loadEventStart": 1722343305381,
    "loadEventEnd": 1722343305381,
  },
}
So how does Sentry populate a trace with those browser spans? As a result of the Performance API recording these metrics with timestamps from the moment a URL is requested in the browser, the Sentry JavaScript SDK is able to access these after initializing, backfill the full list of events that happened chronologically before the web page loaded, and send them as spans to the relevant full trace so they can be visualized in the Trace View.
What happens before a web page loads?
The window.performance provides a window (pun definitely intended) into the many different events that happen before we see any web page content appear in a browser. It returns a Performance object, which contains a timing property, shown in the above code example. While this is a quick way for us to inspect the events recorded by the browser on page load without writing any code, the Performance.timing property is now deprecated and has been superseded by the PerformanceNavigationTiming API (with only some minor changes so far).
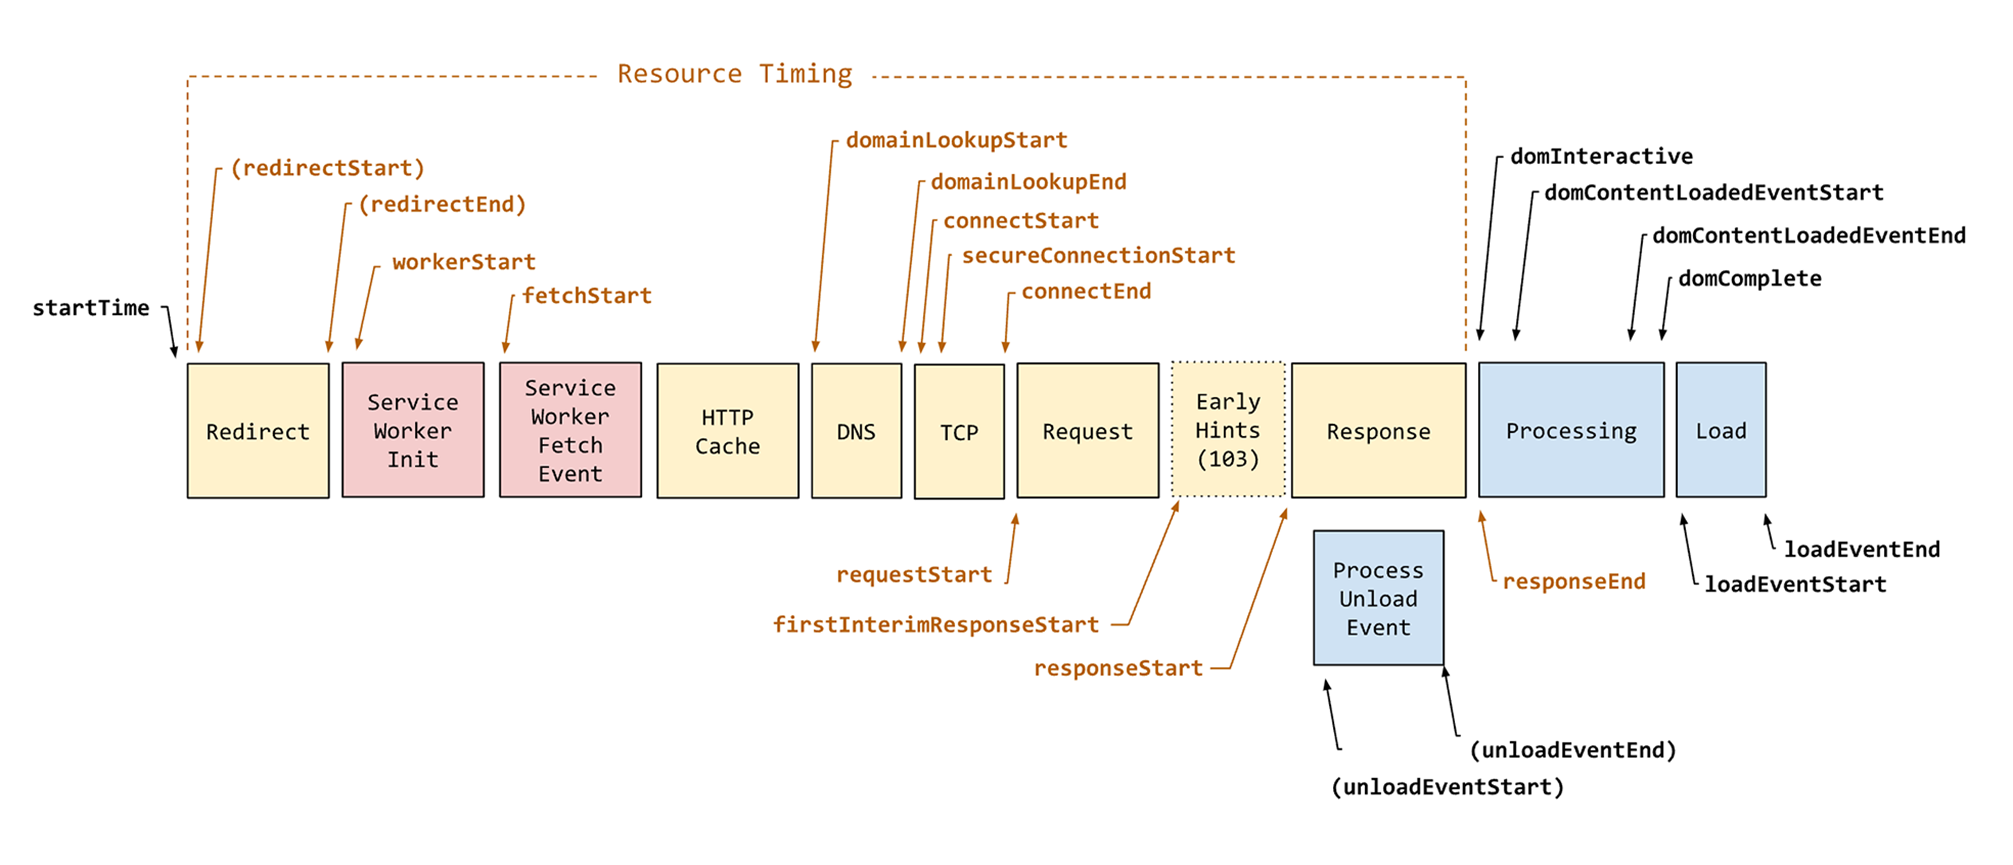
This diagram from the Navigation Timing Level 2 specification shows the order in which PerformanceNavigationTiming events are recorded from the moment a navigation request is made in the browser, to when the load event of the current document is completed. Not all events will be available for each page load, but the order matches what we observed using window.performance above.

Let’s explore each relevant event metric to see what’s happening under the hood, and how it gets calculated by Sentry from particular timestamps to populate the browser spans in the Trace View. And hopefully, with this new knowledge, we’ll begin to understand how we might be able to optimize for web performance before the TTFB.
browser cache
If the resource is being fetched using HTTP GET (e.g. a standard request for a web page), the browser will check the HTTP cache first. fetchStart returns the time immediately before the browser starts checking the cache. The cache span in the Sentry Trace View is calculated as the time between the fetchStart timestamp and the domainLookupStart timestamp.
A non-zero value for a cache span in the Trace View represents the time taken for a browser to retrieve the resource from the browser cache. Longer cache spans could point to the use of slower or older browsers, or users who don’t clear their browser caches very often, if at all.
browser DNS
The next span reports the DNS (Domain Name System) lookup time. When a user requests a URL, the DNS is queried to “lookup” the domain in a database and translate it to an IP address. The total time taken to complete this is calculated by subtracting the domainLookupStart timestamp value from the domainLookupEnd timestamp value.
browser connect
Next, it’s time to measure the time it takes for the browser to connect to a web server. This is known as “connection negotiation”, and is measured as the time between two events: connectStart (when the browser starts to open a connection to the web server) and connectEnd (when the connection to the web server has been established).
browser TLS/SSL
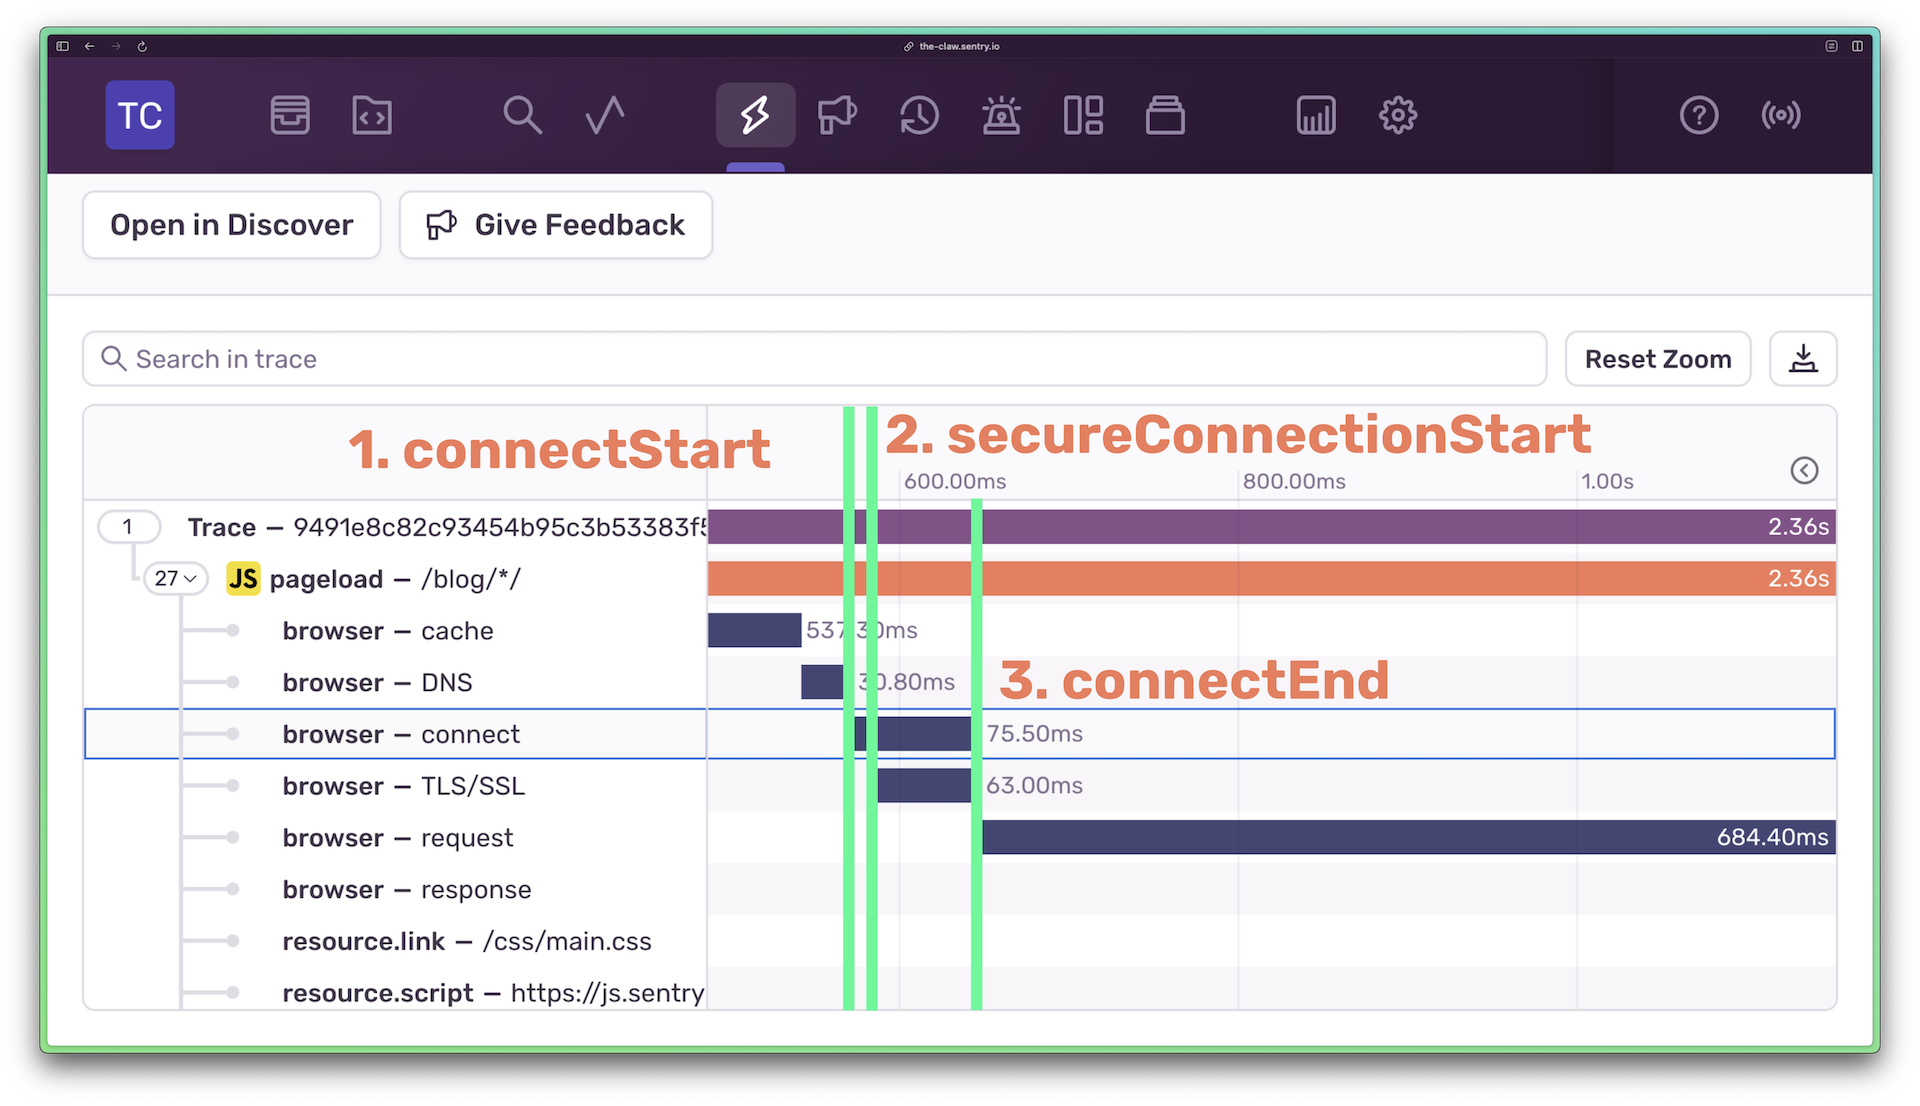
If the web server the browser is connecting to is using HTTPS, a secureConnectionStart event will happen in between connectStart and connectEnd. secureConnectionStart marks when the browser and web server exchange messages to acknowledge and verify a secure encrypted connection, known as TLS (Transport Layer Security) negotiation. The value of secureConnectionStart may be 0 if HTTPS isn’t used or if the connection is persistent.
In Sentry, the connect and TLS events are reported as separate spans. In this image of the Trace View, you’ll notice that the connect event begins, the TLS event begins shortly after, and the connect end event ends as soon as TLS negotiation has finished. This representation of events is useful in being able to identify whether there are any bottlenecks in either the web server connection or the TLS negotiation independently.

browser request
After the (secure) connection with the web server has been established, the browser will officially make the request for a resource, marked by the requestStart event.
browser response
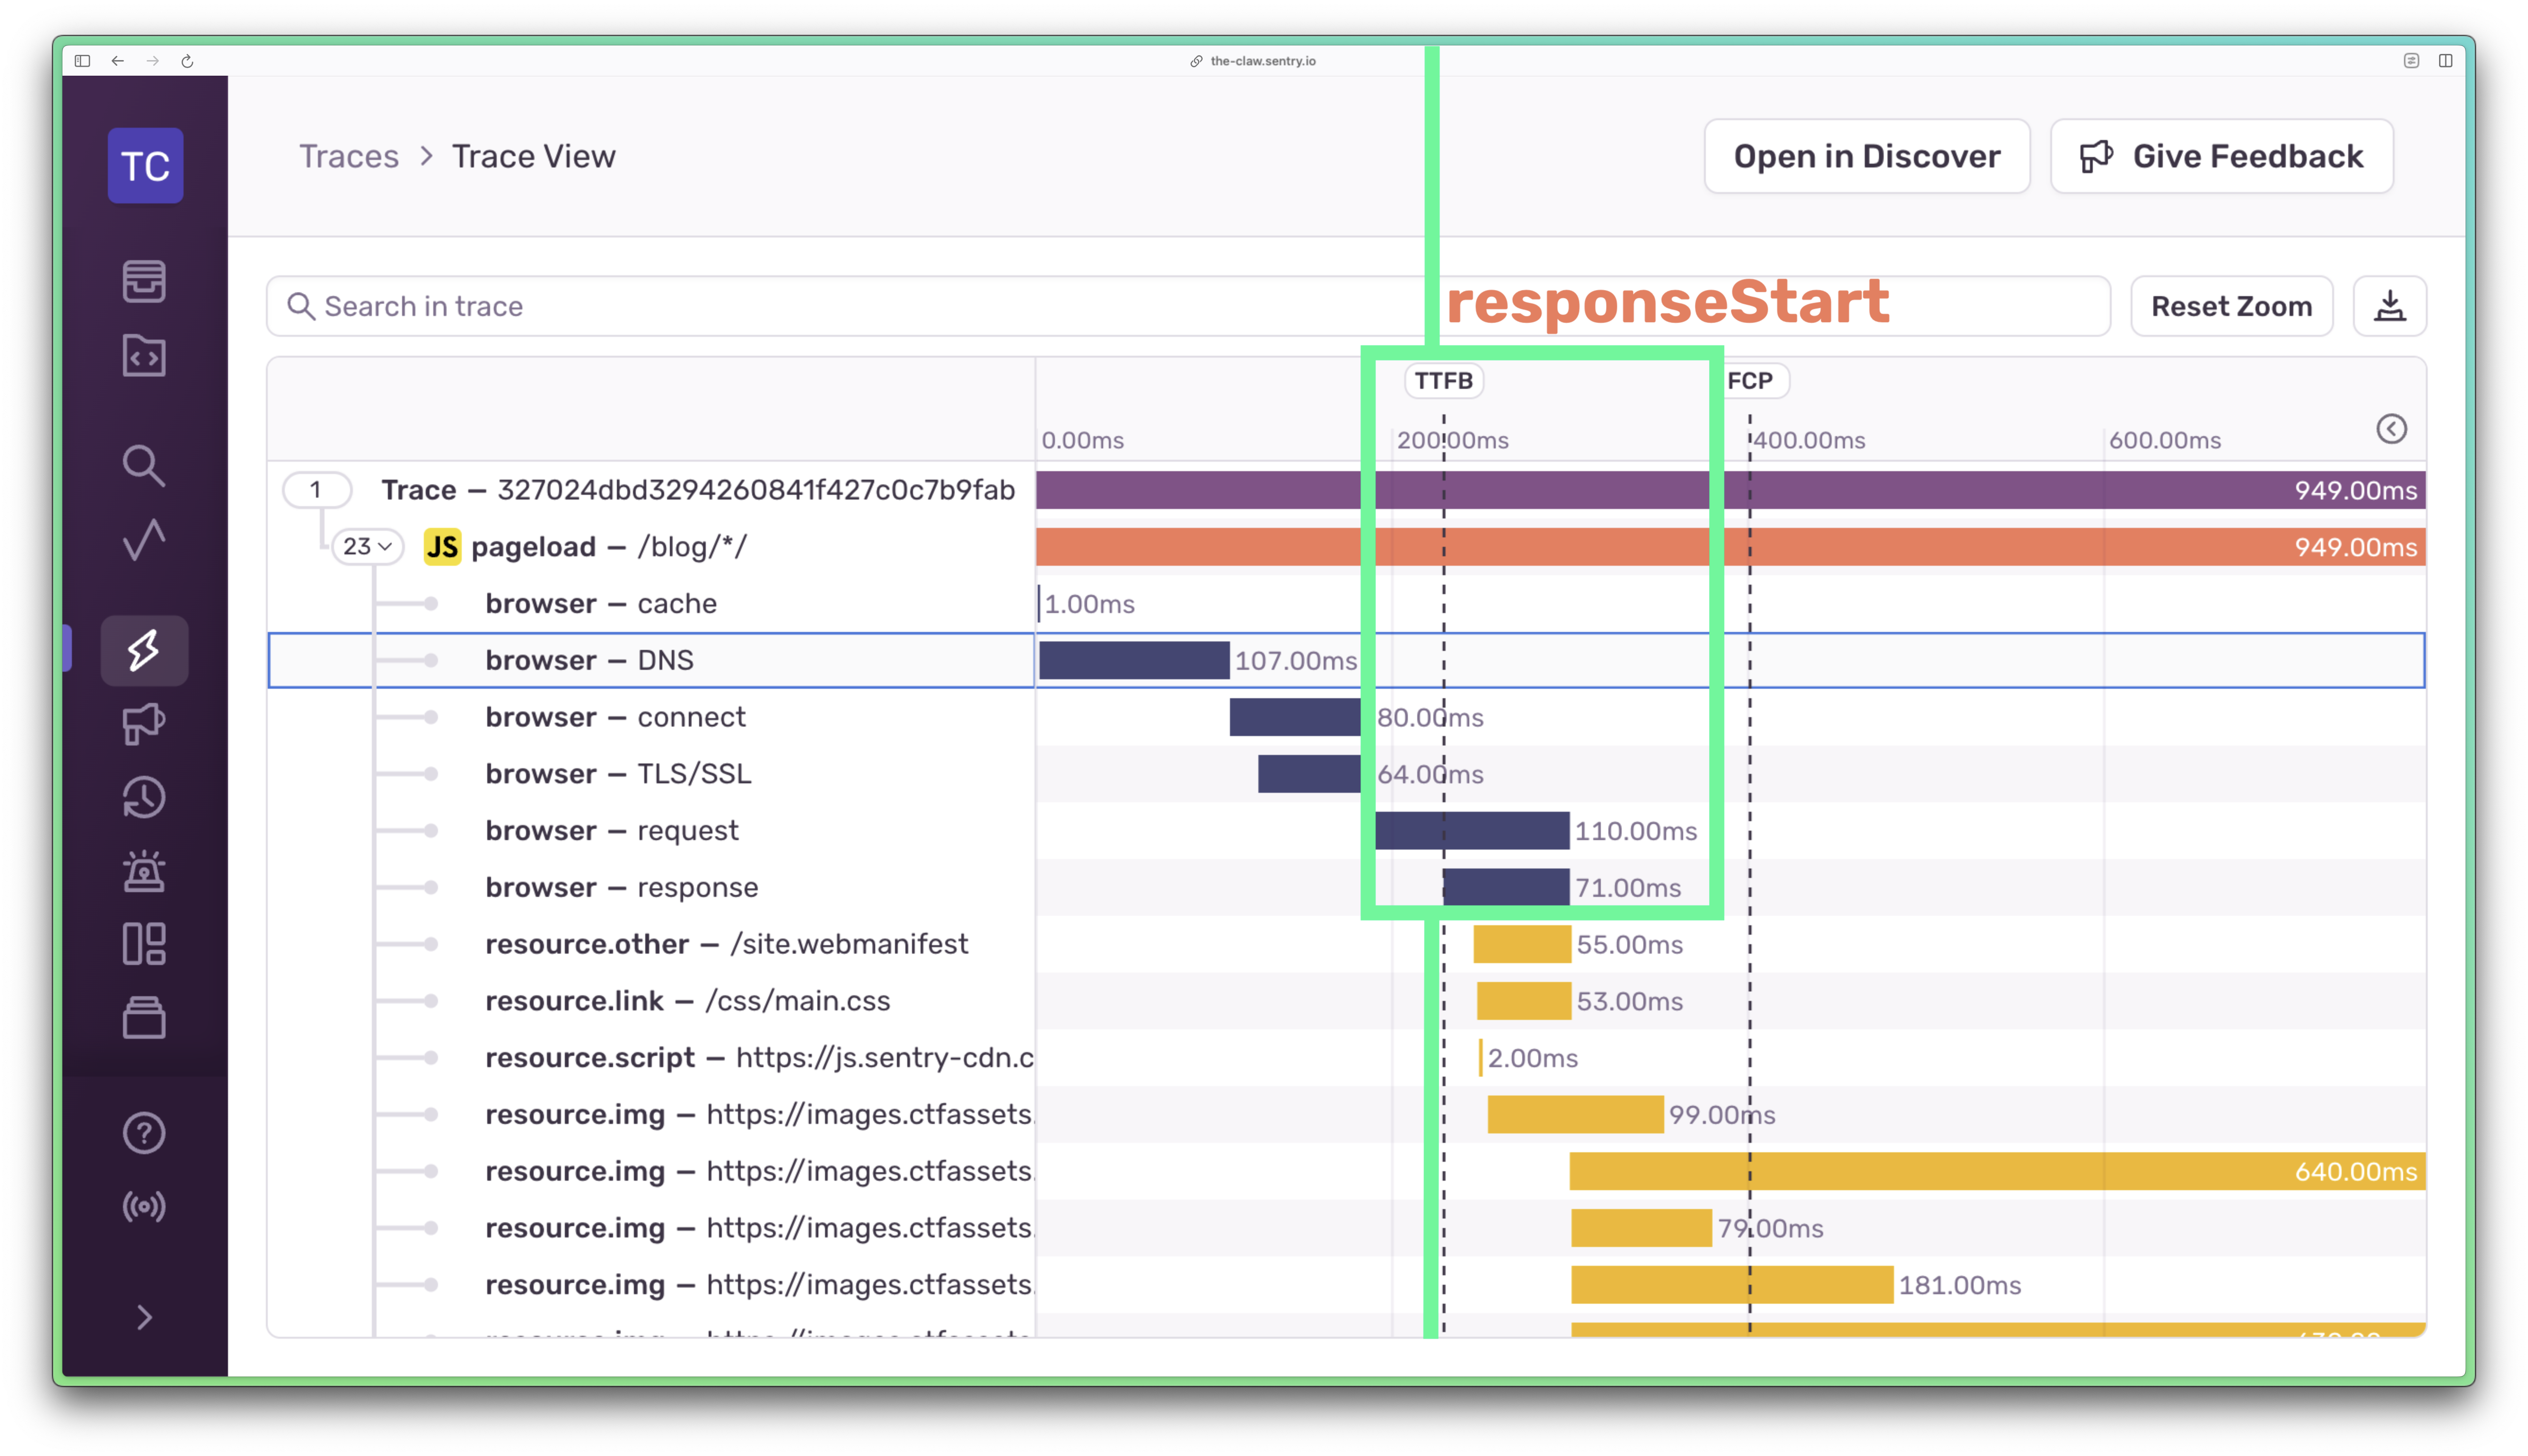
Finally, the browser will receive the first byte of content. In the Sentry Trace View, here’s where the TTFB (Time to First Byte) vertical line is marked.

Can we make PerformanceNavigationTiming events faster?
Now we understand what happens before the first byte of a web page is delivered to a browser, let’s go a little deeper to understand if we might be able to speed up the events that happen in the navigation timeline.
Can you speed up the browser cache retrieval event?
As a developer who wants to improve the performance of their own applications, I’m not sure you can speed up this event for your user-base. However, you probably could speed up this event for yourself by being diligent with your own personal browser caches. Clear your browser caches like you commit changes to a git repository: little and often.
Can you speed up a DNS lookup?
The speed of a DNS lookup can be affected by a number of things, including (but not limited to):
The size of the DNS provider’s infrastructure: fewer “Points of Presence” (POP) around the globe will mean longer latency and slower lookups,
The location of the POPs: if your website visitors are far away from a DNS server, DNS lookup will take longer,
The DNS cache time: DNS is served from a cache until it expires. The length of the DNS cache time is determined by the Time to Live (TTL) value specified on the DNS record (which points a URL to an IP address). The higher the TTL, the less likely the browser will need to perform another DNS lookup on each subsequent request.
Ultimately, speeding up DNS lookups involves investing in a DNS provider that has a large and globally distributed network of POPs. If you’re a developer at a scaled-up enterprise business, this is probably taken care of for you. Additionally, setting the TTL value as high as possible for DNS records that don’t change often is probably a good tactic.
At the time of writing, I checked my personal website DNS records out of curiosity, and I had the TTL set to 5 minutes. This meant that the DNS cache expired every five minutes, causing browsers to do a fresh DNS lookup much more often than needed. Given that I’m not pointing my website URL to a new server, like, ever, I decided to change the TTL to 60 minutes.
In this very limited 5-day experiment on my personal website, I saw fewer non-zero times for the browser DNS lookup spans in Sentry since switching the TTL. If your website is not mission-critical and not money-making, this could be a good solution to help speed up DNS lookup. Bear in mind, though, that if your main servers go down and you want to point your URL to backup servers, it will take up to 60 minutes for all users around the world to see the DNS changes.
That being said, according to Sematext, “The average DNS lookup time is between 20 and 120 milliseconds. Anything between that and under is generally considered very good.” So perhaps this type of micro-optimisation might not be worth needing to remember that your TTL is set to 60 minutes when you need to change to a backup server during a primary server outage.
Improving DNS lookup for third-party resources with rel=”dns-prefetch”
Most front-end websites and apps are probably loading at least one or more resources from third-parties, i.e. resources/images/files/scripts from different domains. Each request to a different domain will also involve a DNS lookup event. Whilst it’s worth noting that third-party resources will be requested after the TTFB and so after the PerformanceNavigationTimeline events we are concerned with in this post, you can attempt to speed up the DNS lookup of these third-party resources by using the attribute rel="dns-prefetch” and associated href value on the <link> tag that requests the resource. This provides a hint to browsers that the user is likely to need to fetch things from the resource’s origin, at which point the browser can try to improve the user experience by preemptively performing DNS resolution for that origin before the resource is officially requested. This is useful when pulling in third-party fonts from Google, for example:

<link rel="dns-prefetch" href="https://fonts.googleapis.com/" />Depending on how many third party resources are requested on page-load in parallel, this could help to speed up the in-browser events that happen after the responseEnd event, i.e. when the browser begins to parse the HTML and request all third-party resources (especially if they are render-blocking resources).
Note: don’t use dns-prefetch on resources fetched from the top-level domain of a website (i.e. resources you host with your website). Read more about using dns-prefetch on MDN.
Can you speed up the connect and TLS negotiation events?
Don’t use HTTPS? I joke. The bottom line regarding TLS negotiation time is that even back in 2010, after Google switched Gmail to use HTTPS for everything, TLS was declared “not computationally expensive anymore”. In the 2013 publication, High Performance Browser Networking, Ilya Grigorik states that “…the early days of the Web often required additional hardware to perform ‘SSL offloading.’ The good news is, this is no longer necessary and what once required dedicated hardware can now be done directly on the CPU.”
The one piece of advice Ilya gave in 2013 is to make full use of TLS Session Resumption, which is a mechanism used to “resume or share the same negotiated secret key data between multiple connections.” In short, it’s a way for your computer and a website to remember each other, so they don’t have to go through the long process of checking the encryption keys (secret password) every time you reconnect. This makes browsing faster and uses less computational power.
Unless you are directly responsible for implementing TLS on a server, making TLS negotiation as fast as possible is probably 99.999% taken care of for you. However, in the same way you can hint to a browser about resources you may need with rel="dns-prefetch", you can go one step further and use rel="preconnect" on links to external resources, which also preemptively performs part or all of the TLS negotiation. Again, this will happen after the PerformanceNavigationTiming events, but it’s good intel, nonetheless.
Can you speed up the browser request and response events (TTFB)?
As a developer, the Time to First Byte (responseStart) is ultimately what you have the most control over in the page navigation timeline. Being mindful of everything that happens between the requestStart and responseStart events, and being ruthlessly efficient in optimizing these events can have a huge impact on your page speed and resulting user experience.
Here are three things to investigate in your websites and apps:
Reduce or eliminate request waterfalls
A “request waterfall” is what happens when a request for a resource (code, data, image, CSS, etc.) does not start until after another request for a resource has finished. In terms of the PerformanceNavigationTimeline, the requestStart event may delay the responseStart event depending on the architecture of your web page or application, and how many synchronous events happen before the browser receives that first byte of data. I experienced this first-hand with my personal website; after I’d noticed that page loads had become excruciatingly slow, I investigated the situation (using Sentry) to find that each page load was making many round trips to an edge server. Choosing to remove those just-in-time requests altogether and include the required data in a static page build meant I radically reduced the TTFB by ~80%.
Perhaps your application makes a series of database calls at the time of the requestStart event. Do these queries need to happen in series, or can they happen in parallel? Even better, can you grab all the data you need from the database in a single query? If React is your thing, check out this post from Lazar on how to identify fetch waterfalls in React.
Better yet: do you need to make any just-in-time calls to the database at all? Or can you follow my lead and build your web pages statically, so all that needs to happen after requestStart is the swift delivery of a static page of HTML from a CDN (Content Delivery Network)? Note: this does not mean you can’t enhance your web page’s interactivity and fetch new data with client-side JavaScript after the page has loaded.
Cache, cache, cache
Speaking of CDNs, which enable content to be cached at edge servers around the world which are located physically closer to visitors, if your website (or a subset of its pages) are not serving personalized and/or dynamic content, you should take advantage of caching: where full HTML responses are stored and delivered on-demand rather than needing to be re-generated at request-time. As a front-end developer who uses modern hosting solutions to deliver my websites where I don’t even need to think about this level of configuration, I’m not going to pretend to be an expert on caching. But I will share this nugget of information from Google’s article, Optimize Time to First Byte:
For sites that frequently update their content, even a short caching time can result in noticeable performance gains for busy sites, since only the first visitor during that time experiences the full latency back to the origin server, while all other visitors can reuse the cached resource from the edge server.
Similarly to TLS negotiation, as a front end developer in 2024, this is something we don’t often have to worry about; it’s taken care of for us thanks to the tools at our disposal. And speaking of modern tools, many front end frameworks and libraries are now bringing HTML streaming to the masses.
Harness the power of HTML streaming
HTML streaming is where, instead of serving the entire HTML document at once, servers send pieces of it over time. The browser receives these pieces of HTML and can start parsing them, and even rendering them, so the web page can appear to load more quickly. Instead of waiting to receive an entire HTML document in between the requestStart and responseStart events, which may also involve database calls and other logic processing, HTML streaming allows for the responseStart event to happen earlier, thus reducing the TTFB.
If you’re working in the React ecosystem and want to know more, Lazar goes in-depth on HTML streaming in The Forensics of React Server Components.
Knowledge is power
All of this data about what happens before a web browser receives the first byte of data of a web page is pretty empowering. But the real power lies in putting that data in context in the Sentry Trace View. In being able to visualize and trace PerformanceNavigationTiming events and issues, we open up the door to being able to effectively debug slow parts of that timeline at a granular level, and make those all-important micro-optimizations where possible.
If your web pages and applications are as fast as they can be, however, hopefully this article has given you some useful information. Perhaps you could use your new-found knowledge on DNS to wow people at all the cool parties you probably attend.
Originally posted on blog.sentry.io
